
The State of Home Insurance: Where Home Insurers Are Competing for Customers Again
Home insurers spent most of the past decade losing money. From 2017 to 2024, U.S. home insurers posted underwriting losses in all but one year, including a $15.2 billion loss in 2023, the industry’s worst this century. Costly storms and wildfires hit more homes in risky areas, and the pandemic sent rebuilding costs soaring: Prices for home construction materials rose 36% from 2018 to 2022, according to the Treasury Department.
But in 2025, U.S. home insurers finally returned to profit, helped by premiums that more accurately matched risk and a relatively calm hurricane season. Unique data pulled from MediaAlpha’s marketplace shows what came next.
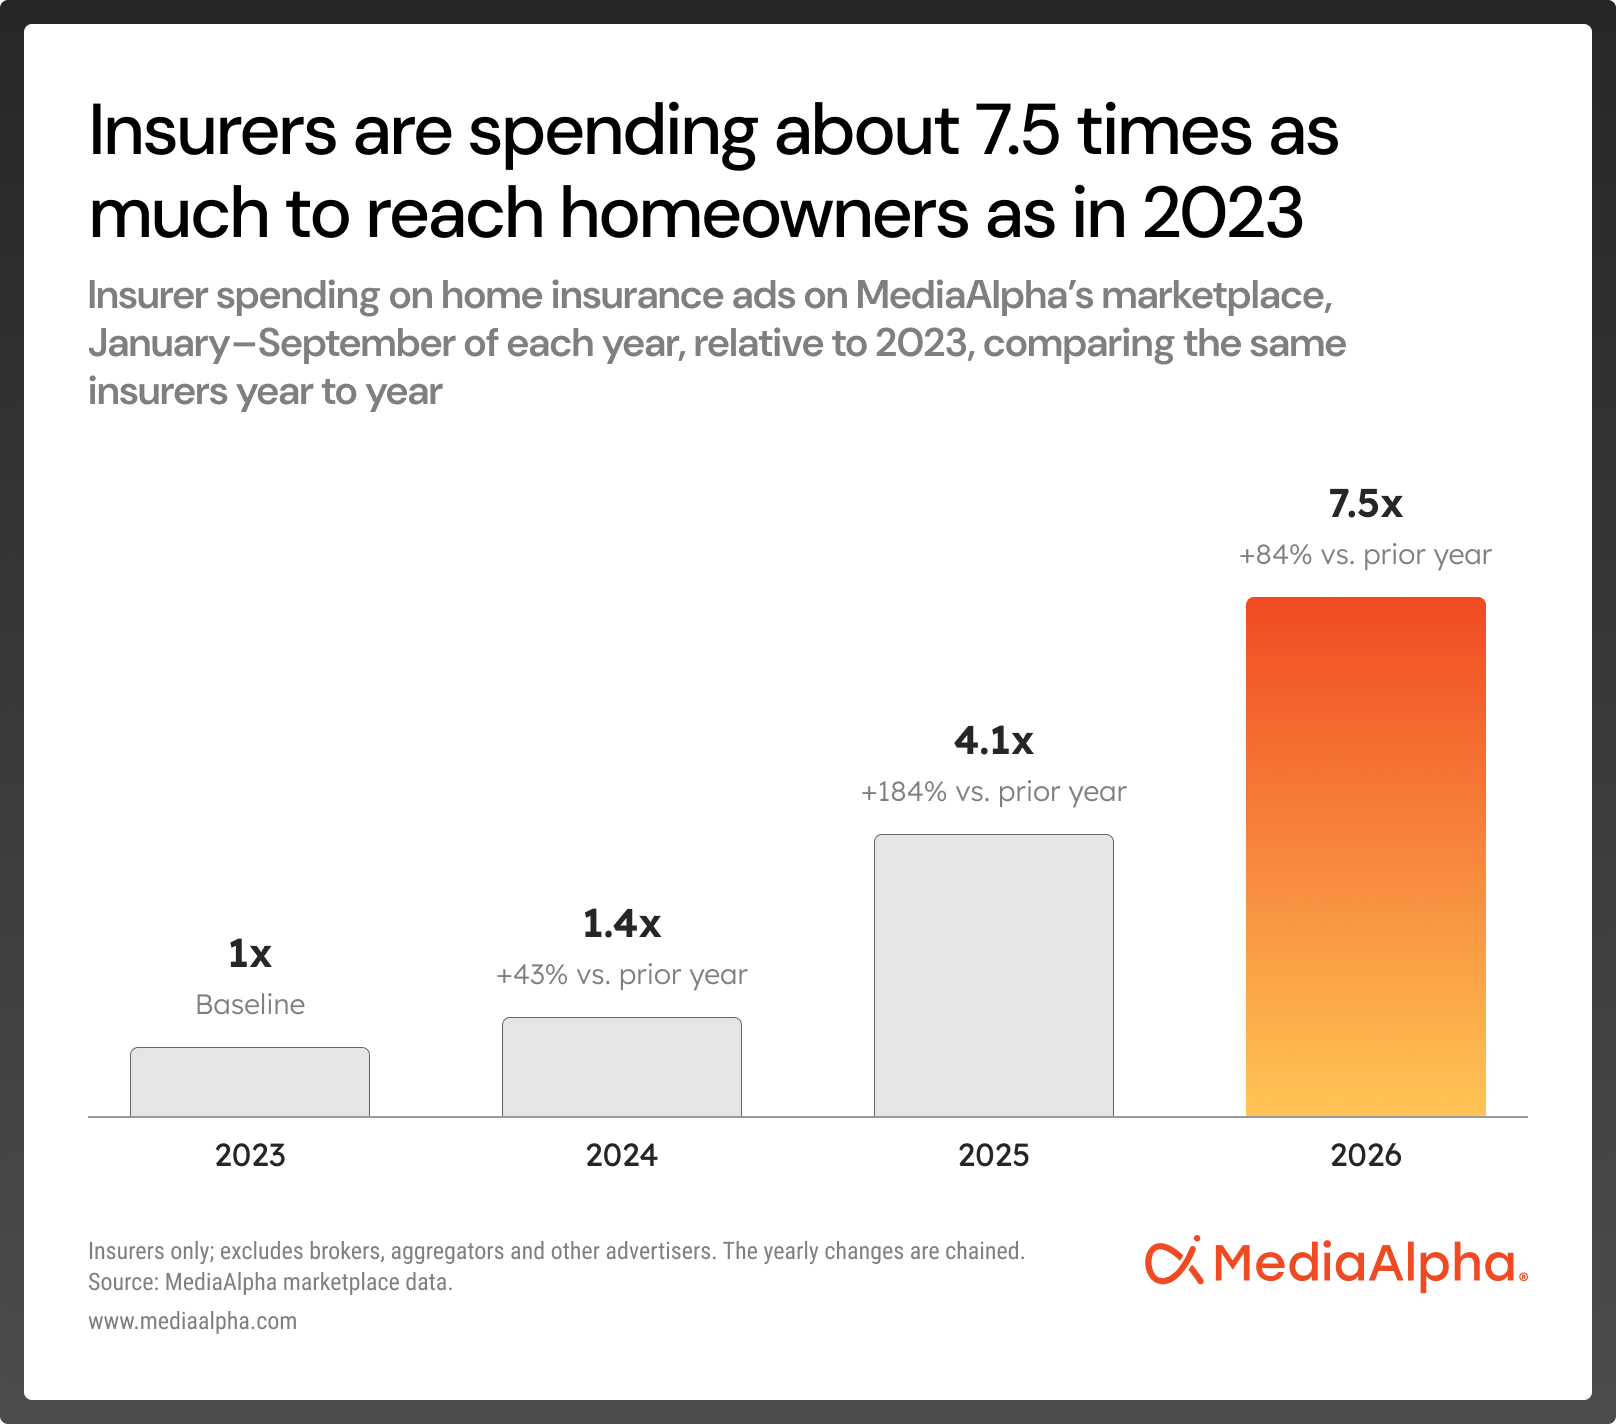
- Insurers are back in the ring to compete for homeowners again. On MediaAlpha’s marketplace, insurers already advertising there spent about 7.5 times as much on home insurance ads in the first nine months of 2026 as in the same period of 2023. Insurers advertising in both 2025 and 2026 increased their spending 84% from January to September this year compared to the same period last year, after nearly tripling spending in 2025 compared to the prior year, and insurers now advertise in about twice as many state markets each month as they did in 2023.
- Homeowners are shopping around. Home insurance searches on MediaAlpha’s marketplace nearly doubled in January–September 2026 from the same period of 2025, to a record 122 million, and most of those shoppers* (62%) already had a policy.
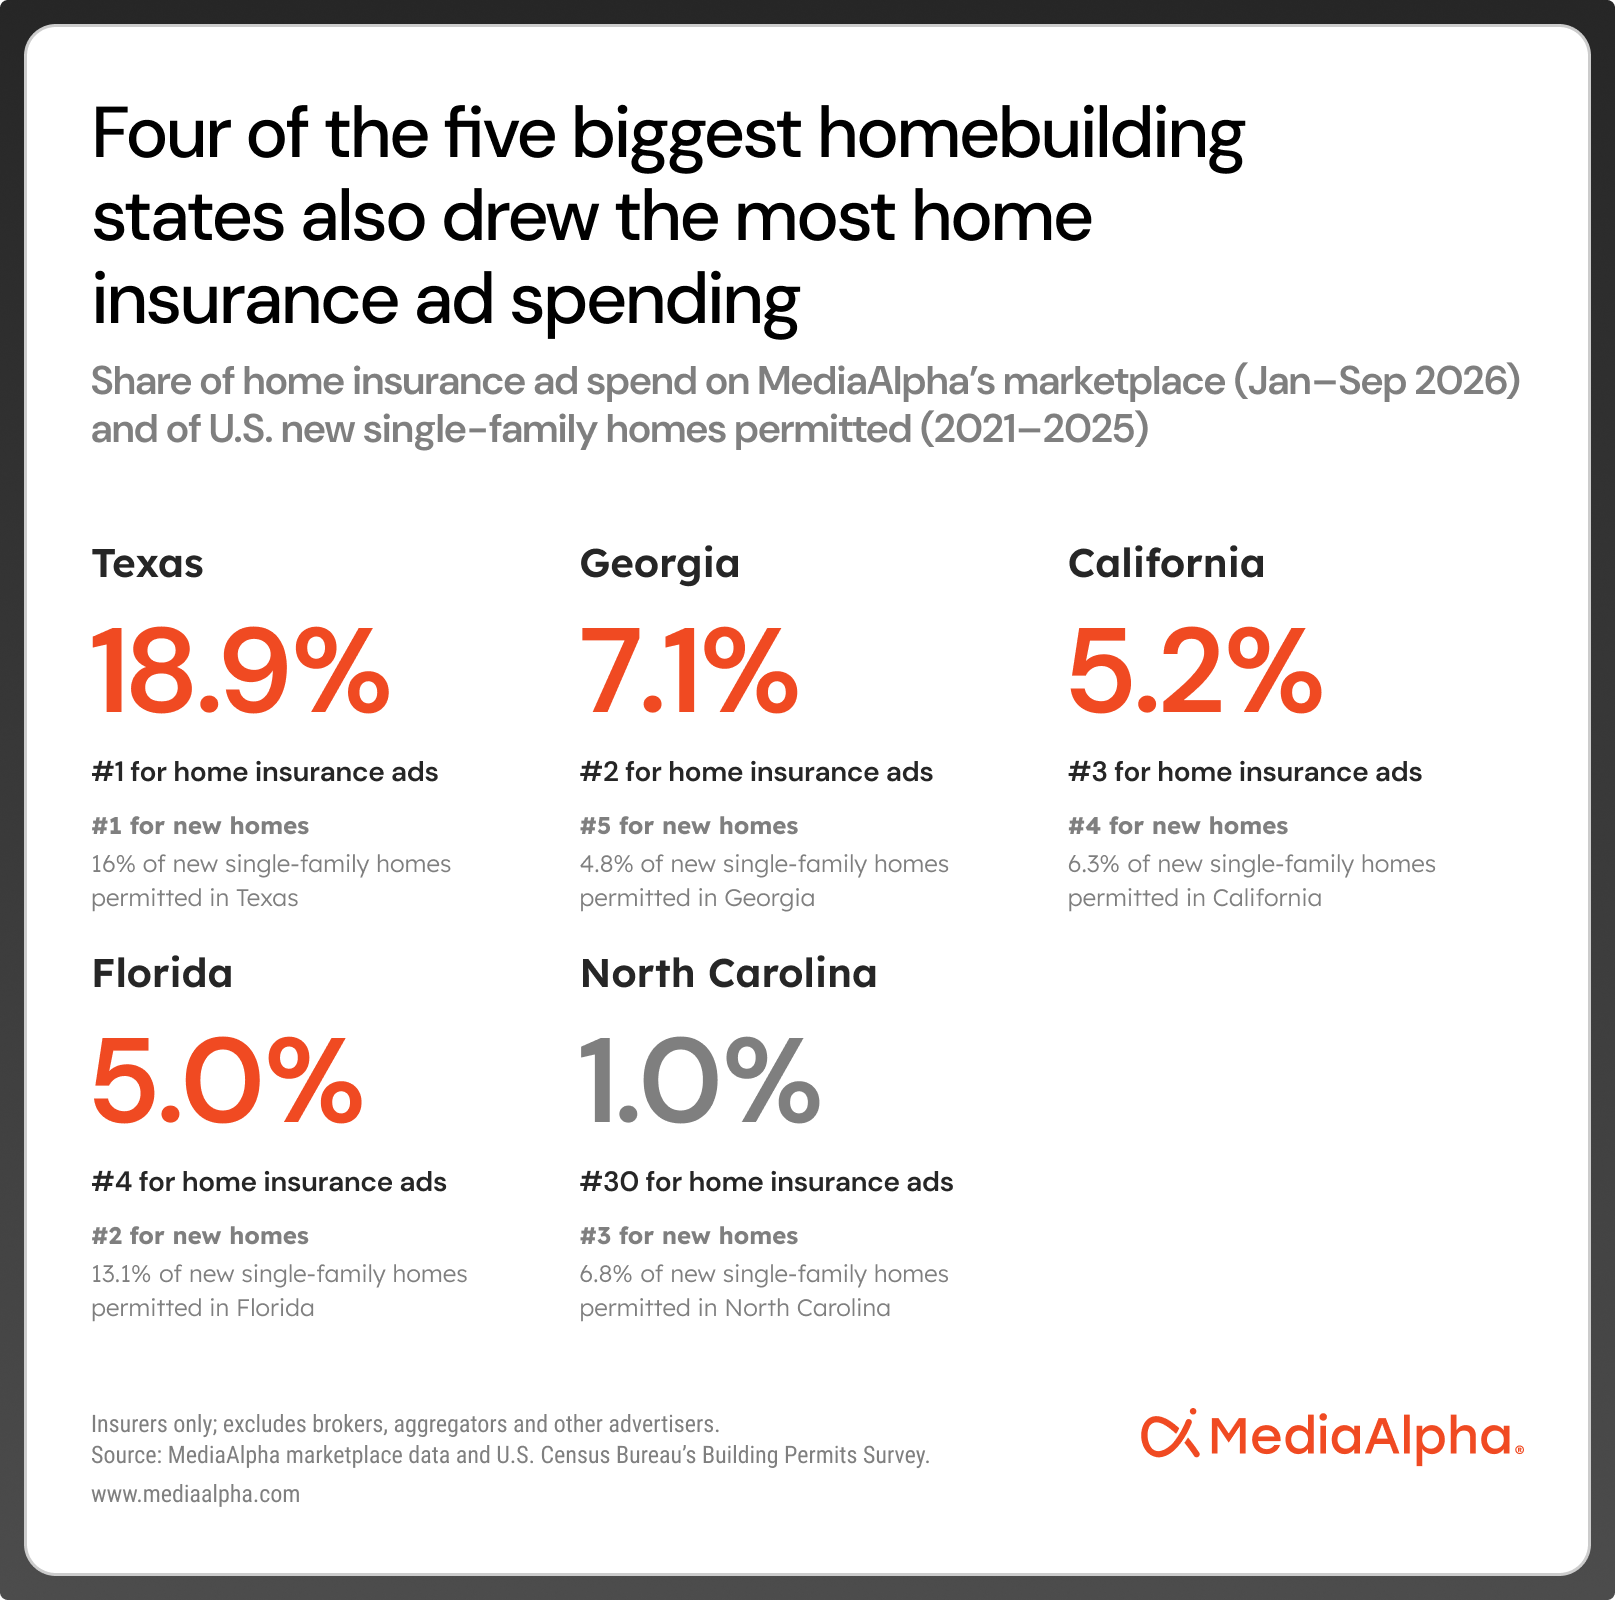
- Naturally, insurers mostly follow new home development. Four of the five states building the most new single-family homes are MediaAlpha’s largest home ad markets by insurer spending.
- Texas, which permitted about 783,000 new single-family homes from 2021 to 2025, more than any other state, alone drew about 19% of insurer home ad spending on MediaAlpha’s marketplace in January–September 2026. That’s more than California and Georgia combined, which rank fourth and fifth for new homes, with about 307,000 and 237,000 permitted over the same period.
- North Carolina is the exception: third for new homes, 30th for insurer home ad spending. One possible reason: A state rate bureau sets home insurance rates there, and the state approved about a third of the increase the bureau requested in 2024 (more below).
- Extreme weather events rarely drive insurers away for long. After Hurricanes Helene and Francine, insurers already advertising in Georgia and the Carolinas on MediaAlpha’s marketplace kept spending in line with the rest of the marketplace, where spending rose 54% from summer 2024 to January 2025. Florida was the exception: Insurers cut spending by about two-thirds after Helene and Milton, and four months later it was still 13% below its pre-storm level.
- Rule changes can reopen a market. Insurers’ home ad spending in California on MediaAlpha’s marketplace rose nearly sixfold in December 2024, the month the state finalized regulations allowing insurers to use forward-looking catastrophe models, not just historical loss data, to set rates, part of its Sustainable Insurance. Strategy. Spending kept climbing after the Los Angeles fires a month later. In Florida, reforms in 2022 and 2023 brought insurers back to the state.
- Markets can surprise. Some of the biggest moves were in unexpected states. Georgia is now MediaAlpha’s second-largest home ad market, with average monthly home ad spending per insurer up 148% in January–September 2026 compared with the prior year period. In Illinois, average monthly home ad spending per insurer on MediaAlpha’s marketplace roughly tripled (+203%) even as fewer insurers advertised, ahead of a new rate review law that takes effect in July 2027.
For years, the home insurance story was about retreat: which insurers were pulling back, from where, and why. With profits returning, a different question matters more: where are insurers competing for homeowners again?
MediaAlpha’s marketplace offers an early answer. Insurers choose where and when to spend to reach shoppers, so their advertising activity shows where they see opportunity, often before it appears in policy counts or rate filings. This report draws on that spending to show where competition is returning, where it isn’t, and why.
Three forces shape the picture: how fast a state is building new homes, how exposed it is to disasters, and how its rules let insurers set rates. Each pulls insurers in a different direction, and they combine differently in every state.
How carriers bounced back in home, by the numbers
With profits back, U.S. insurers are spending more to win homeowners. Insurers that advertised on MediaAlpha’s marketplace in both 2025 and 2026 increased their home insurance ad spending 84% in January–September 2026 from the same period of 2025. That followed a nearly threefold increase in 2025 compared with 2024. Measured this way, year over year among insurers advertising in both years, home ad spending on MediaAlpha’s marketplace has grown about 7.5-fold since 2023.
Home insurance searches on MediaAlpha’s marketplace nearly doubled (up 95%) from the same period the prior year, reaching 122 million in January–September 2026: the highest figure reported in search data going back to 2016.
Most of those shoppers aren’t buying insurance for the first time. According to MediaAlpha data, among home insurance searches where the shopper’s coverage status was known (75%), nearly two-thirds (62%) already had a homeowners insurance policy, suggesting many are evaluating whether to switch.
Insurers expect the competition to continue. In most states, the typical insurer was still spending more on home insurance ads in January–September 2026 than a year earlier, a sign that competition for homeowners isn’t over. Insurers are also reaching into more states: On MediaAlpha’s marketplace, insurers advertised in about twice as many state markets each month in 2026 compared to 2023.
The three forces that affect how home insurance works
Where insurers choose to compete, and what homeowners pay for a policy, largely comes down to three forces:
- how fast a state is building new homes,
- how exposed is that state to disasters like hurricanes and wildfires, and
- how a state’s regulations allow insurers to set rates.
Where the building is, insurers follow
New homes create more demand for homeowners insurance, and new construction is concentrated in a handful of states. Five states–Texas, Florida, North Carolina, California, and Georgia–issued about 47% of new single-family home permits from 2021 to 2025, according to a MediaAlpha analysis of Census Bureau data.
Insurers follow the building. Four of those five states were MediaAlpha’s four largest home advertising markets for insurers in January–September 2026. Texas alone drew about 19% of insurer home ad spending on MediaAlpha’s marketplace in January–September 2026, followed by Georgia, California, and Florida.
Not every fast-growing state draws insurers, though. Measured per resident, the fastest-building states, South Carolina, Idaho, North Carolina and Delaware, each built new homes at about twice the national rate from 2021 to 2025, yet none ranked higher than 20th for insurer home ad spending on MediaAlpha’s marketplace. Insurers seem to have followed the size of a market more than its pace of growth.
But while new home building is an attractive lure, there are two other forces at play: how markets fare when disaster comes knocking and how states regulate insurers’ ability to set rates.
Climate disasters are getting costlier, but insurers keep competing
2025 brought 23 U.S. weather and climate disasters that each caused at least $1 billion in damage, totaling about $115 billion, more than half of it from the Los Angeles wildfires, according to Climate Central.
The cost of disasters has been climbing for decades. One of the biggest drivers of rising disaster costs in the U.S. is an increasing number of – often more valuable – homes built in areas exposed to climate risks. Homeowners in the most exposed areas feel it most. Since 2021, premiums in ZIP codes at severe or extreme risk of wind or wildfire damage have grown 6% to 10% a year, compared with 1% to 4% in lower-risk areas, according to a Government Accountability Office analysis. They’re also more likely to lose coverage: In the most recent data from the Treasury Department’s Federal Insurance Office, covering 2018–2022, homeowners in the riskiest fifth of ZIP codes were about 80% more likely to have their policies not renewed than those in the safest.
That might suggest insurers are fleeing disaster zones. But MediaAlpha’s data shows the opposite: Insurers are competing for homeowners, even in disaster-prone states.
To see how insurers responded to disasters, MediaAlpha tracked home insurance ad spending by insurers that were already advertising on its marketplace in each state before a disaster hit. The data pointed to several recent examples where home insurers kept competing, despite severe weather incidents.
September 2024’s Hurricane Helene did its worst damage well after making landfall in Florida’s Big Bend, flooding parts of Georgia and South Carolina all the way into western North Carolina. Four months later, in January 2025, insurers already advertising in those states were spending more on MediaAlpha’s marketplace than before the storm: 93% more in Georgia, 79% more in South Carolina and 47% more in North Carolina. In Louisiana, insurers already advertising there spent 27% more four months after Hurricane Francine.
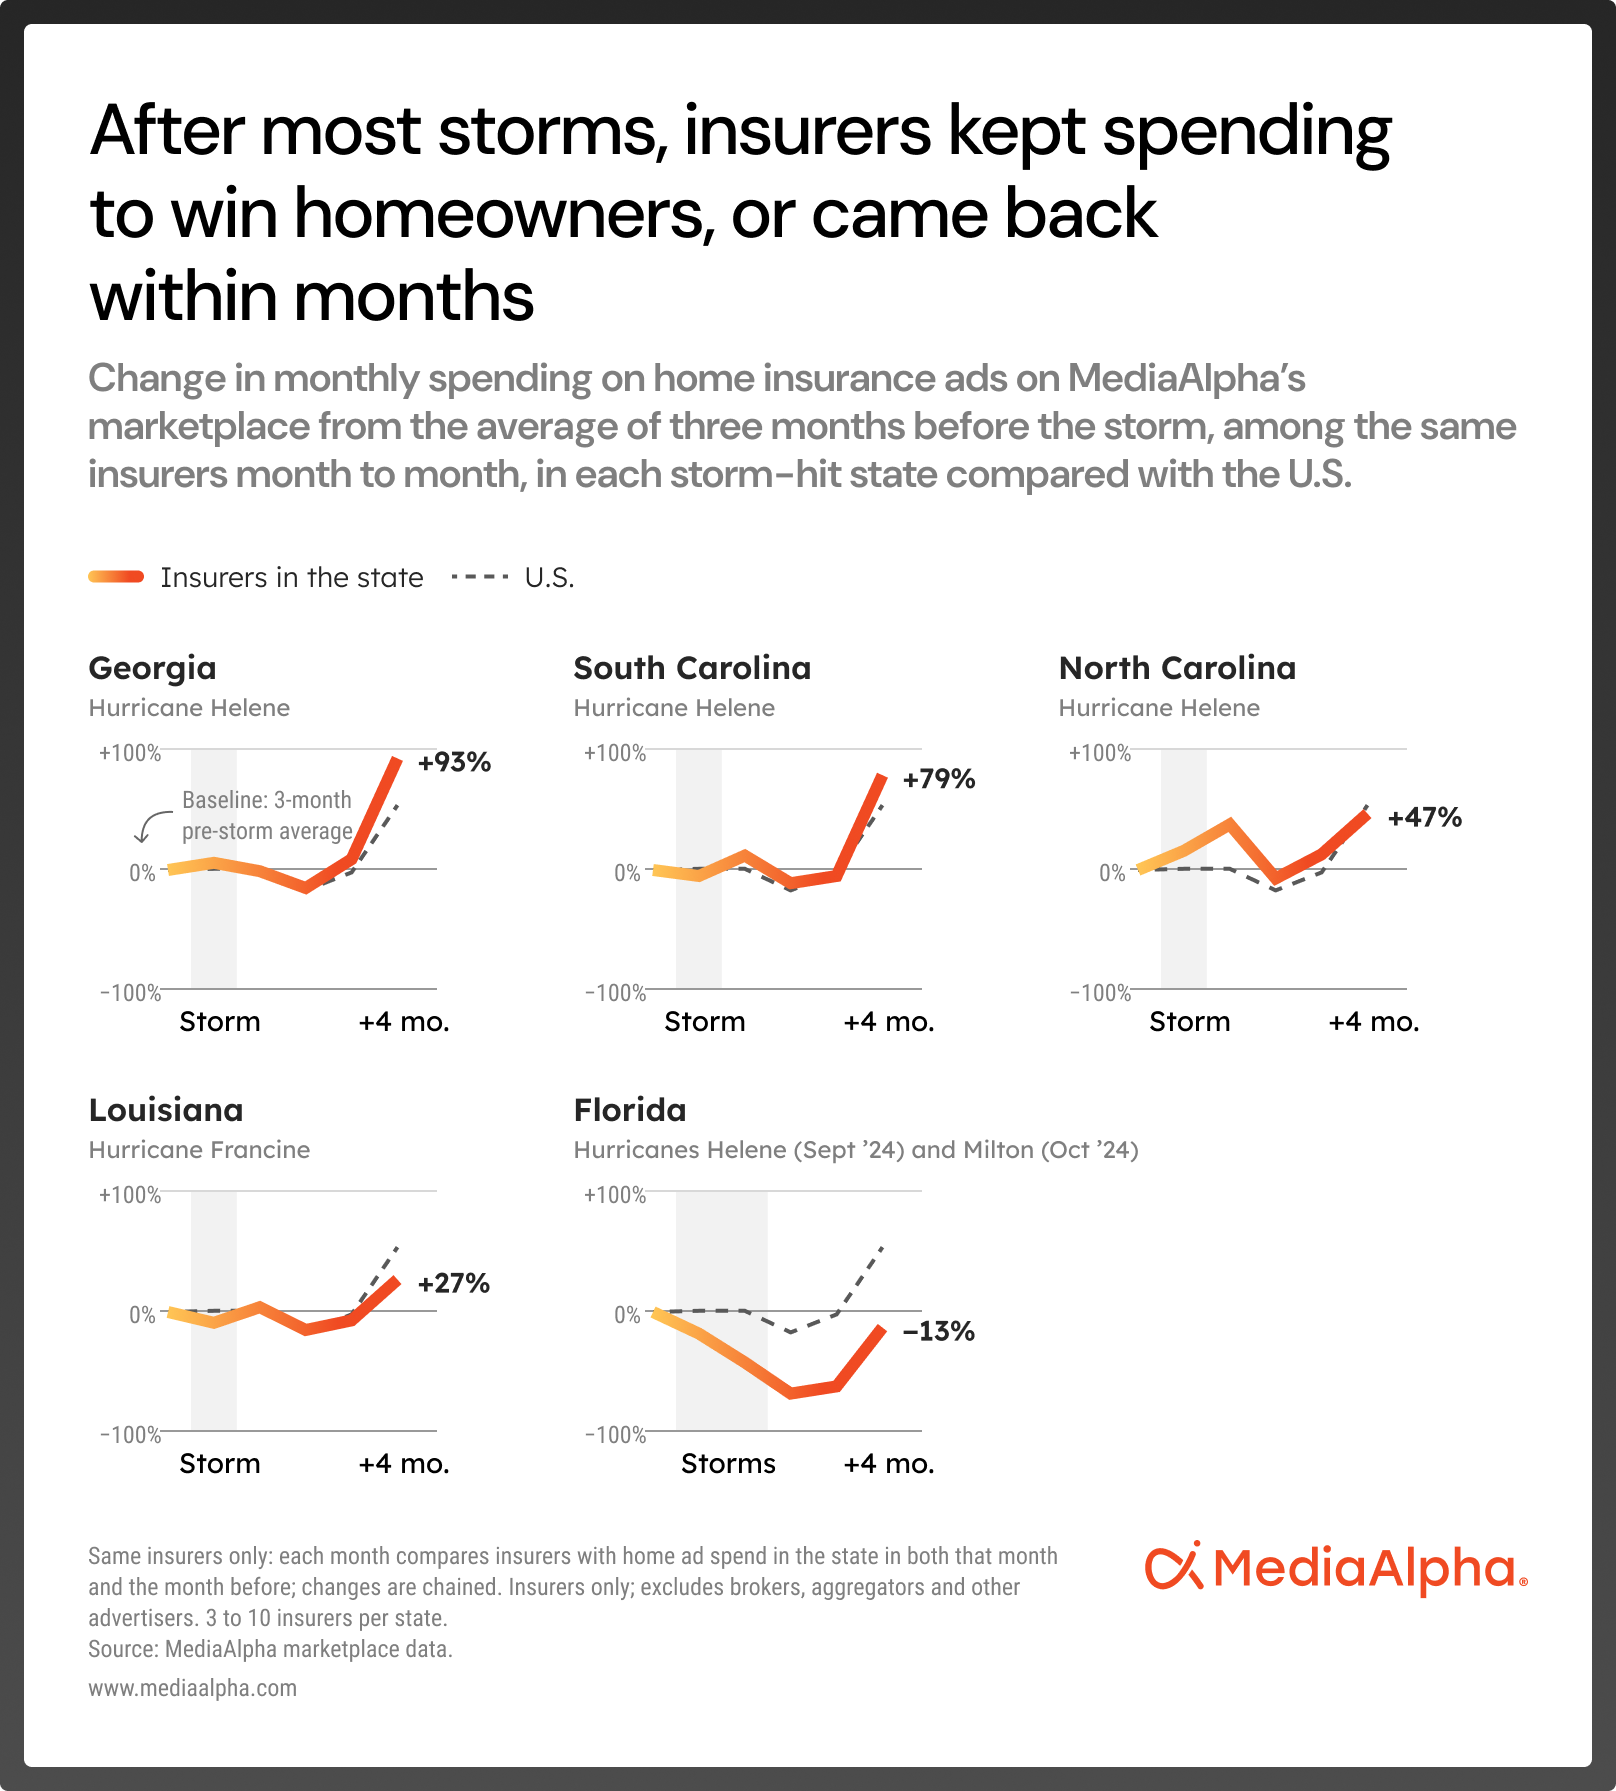
Florida was a different story. Hit by Hurricanes Helene and Milton in just two weeks, the state saw a sharp pullback: Within two months, insurers already advertising in Florida cut their spending there by about two-thirds. Four months after Helene, spending on MediaAlpha’s marketplace in Florida was still 13% below its pre-storm level, even as insurer spending nationwide had climbed with the new year’s budgets. For Florida’s market, the storms brought whiplash rather than a quick bounce back.
A disaster doesn’t necessarily mean fewer options for homeowners. In most of the hard-hit states we tracked, insurers kept competing for business, and even where they pulled back, they began returning within months.
Regulation: Who sets insurance prices?
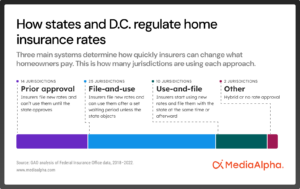
Nearly every state regulates home insurance rates, but some give insurers far more room to adjust prices than others. According to a GAO analysis of Federal Insurance Office data, all but two states fall into three main regulations: prior approval, file-and-use, and use-and-file.
Where insurers can adjust rates quickly, they’re often more willing to keep writing policies and compete for customers. Rate flexibility helps keep insurers in a state, and rule changes can bring them back. That doesn’t mean one causes the other, and stricter rules can protect homeowners from sudden rate increases. You can see both sides of this in action in California, North Carolina, and Illinois.
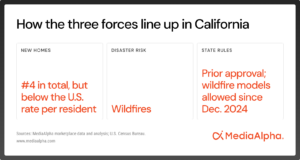
California requires prior approval for rate changes and, for years, barred insurers from using forward-looking catastrophe models to set rates, relying instead on historical loss date. Then, in December 2024, the state finalized new rules allowing those models, and insurer home ad spend on MediaAlpha’s marketplace jumped that month by 634% compared to December 2023.
In North Carolina, a state rate bureau files home insurance rates on insurers’ behalf, and the insurance commissioner must approve them. In 2024, the bureau asked for a 42.2% average rate increase; it settled for about 15%, phased in over two years, and insurers can’t seek another increase before June 2027. Smaller increases help homeowners, but they may give insurers less reason to compete. So while North Carolina ranks third in the country for new single-family homes, the state ranks 30th for insurer home ad spend on MediaAlpha’s marketplace.
Illinois sits at the other end: As a use-and-file state, it lets insurers start using new rates before filing them, and until a new law takes effect in July 2027, the state can’t review them. (More on Illinois below.)
State by state: how the forces play out
Growth, disaster risk, and state rules have shaped insurer competition, but these factors combine differently in every state. In this section, we dive into three of the states with the most closely watched home insurance markets – Texas, California, and Florida – as well as states like Georgia and Illinois with surprising shifts worth understanding.
Everything is, indeed, bigger in Texas – including insurer spend
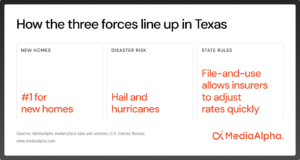
Texas is where the three forces line up most clearly: the state builds more new single-family homes than anywhere else, faces costly hail and hurricane disasters, and has rules that let insurers adjust prices quickly as a file-and-use state. That combination makes it a strategic market for insurers competing to win homeowners. Texas drew about 19% of all insurer home ad spend on MediaAlpha’s marketplace in January–September 2026, more than Georgia and California combined.
Texas is a file-and-use state: Insurers can put new rates in place without waiting for state approval, as long as they notify the state. That lets them raise prices quickly after costly years in a state that has been the nation’s hail damage capital for 11 years running, with average increases of about 20% in both 2023 and 2024, according to the Texas Department of Insurance. Now that profits are back, rates are starting to fall.
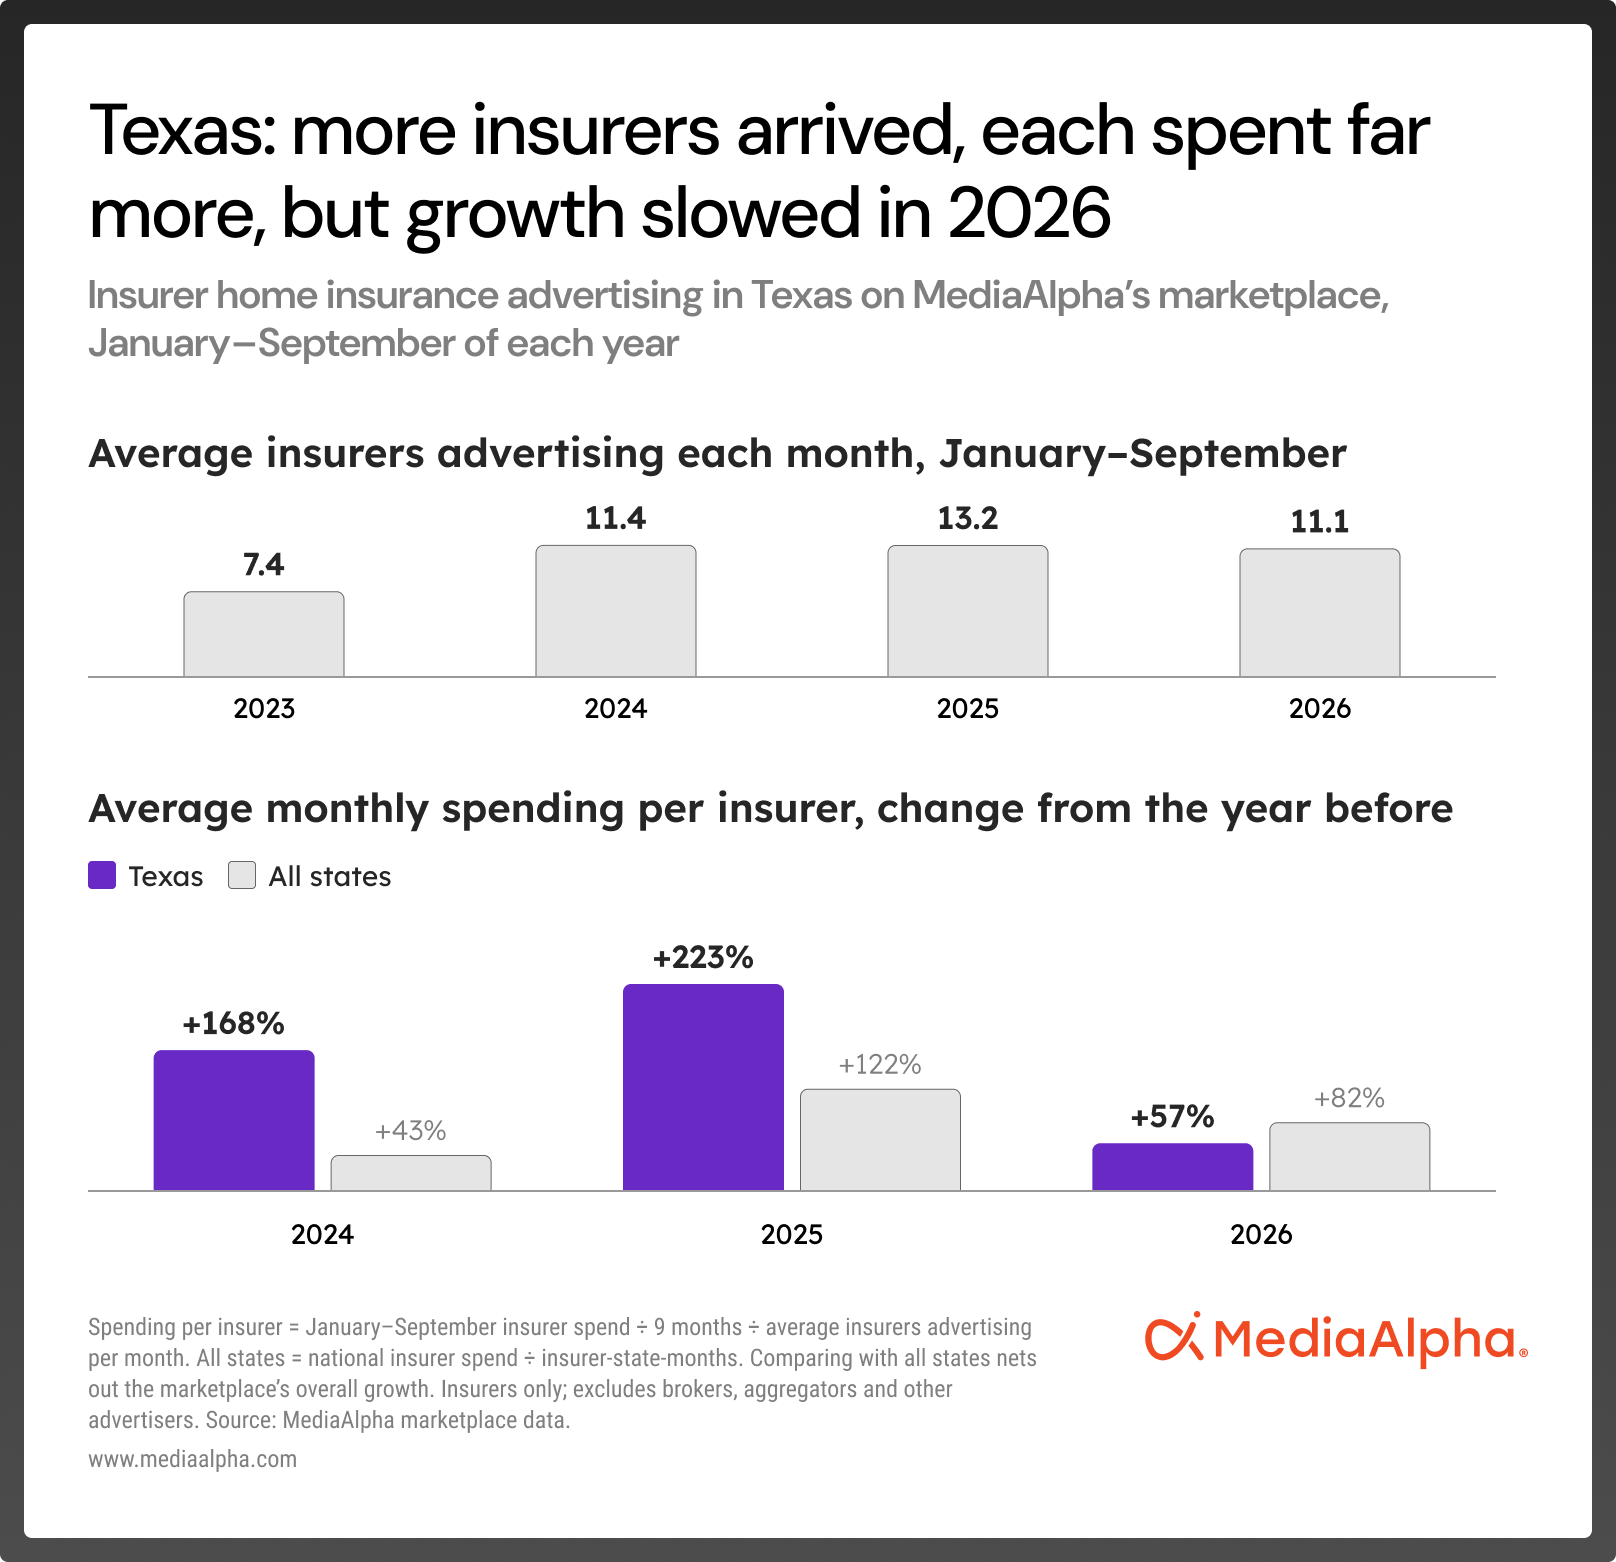
However, while Texas is still the biggest market, it is no longer the fastest-growing: Average monthly home ad spending per insurer on MediaAlpha’s marketplace rose 57% in January– September 2026, compared with the same period in 2025, while across all states, it rose 82%, as growth shifted toward Georgia and California.
In wildfire-prone California, insurers spent more after the fires, not less
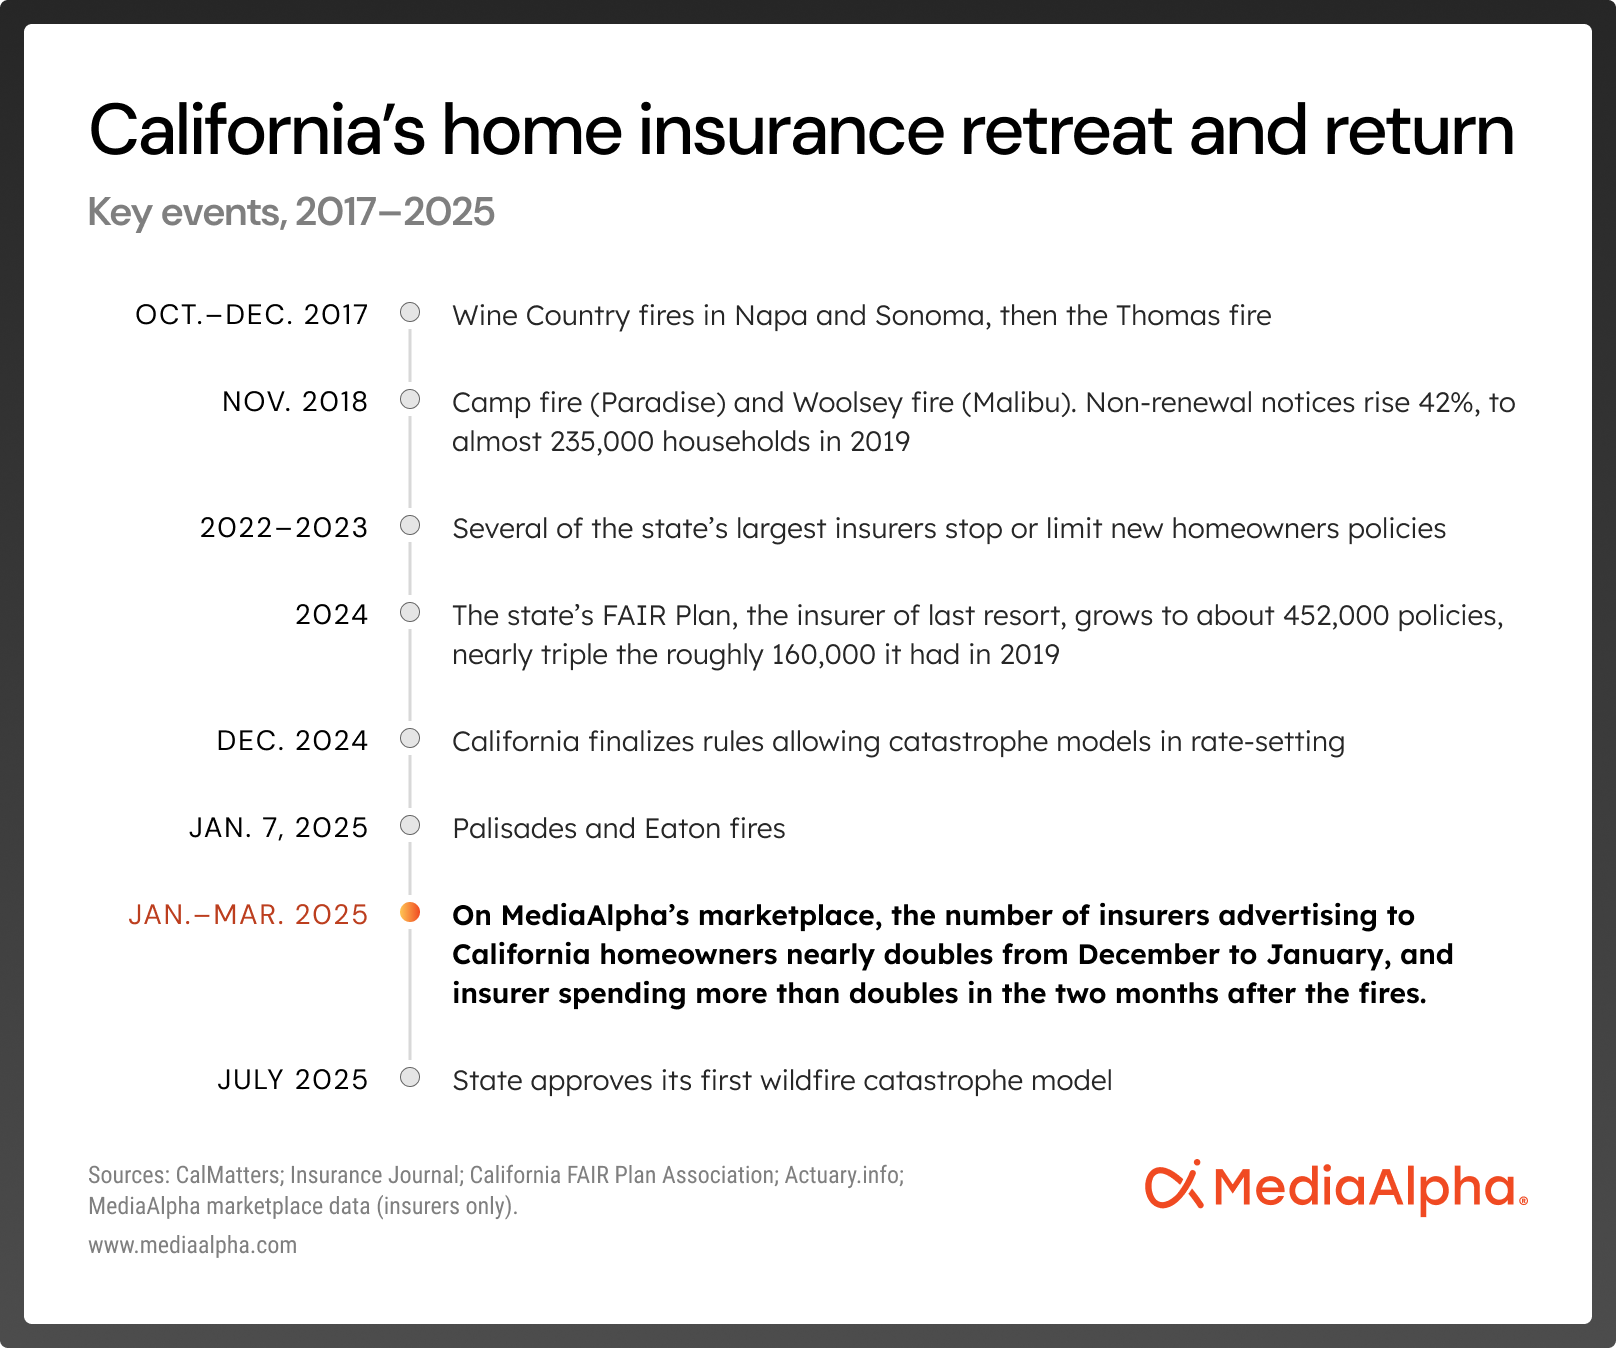
When the Palisades and Eaton fires tore through Los Angeles in January 2025, causing the largest insured wildfire loss on record, insurers didn’t pull back from California. Instead, they spent more. From January through September 2025, an average of 8.3 insurers advertised home insurance in California on MediaAlpha’s marketplace each month, up from 5.9 in the same period of 2024 and 3.9 in 2023. Each insurer also spent far more: Average monthly spending per insurer rose about 11x from 2024, compared with about 2.2x (122%) across all states.
One likely factor: a regulation change finalized a month before the fires in December 2024. California requires state approval for rate changes, and for years insurers couldn’t use forward-looking catastrophe models to set rates. As fires grew more destructive, insurers pulled back. The 2017 and 2018 wildfires wiped out decades of industry profits, and by 2023, several of the state’s largest insurers stopped or limited new policies.
But in December 2024, the state finalized a new administrative regulation (10 CCR § 2644.4.5) allowing catastrophe models in rate-setting. That month, insurer home ad spending on MediaAlpha’s marketplace in California rose nearly sixfold from November, and by March 2025 it was about 24 times its pre-rule level, even after the January 2025 Los Angeles wildfires.
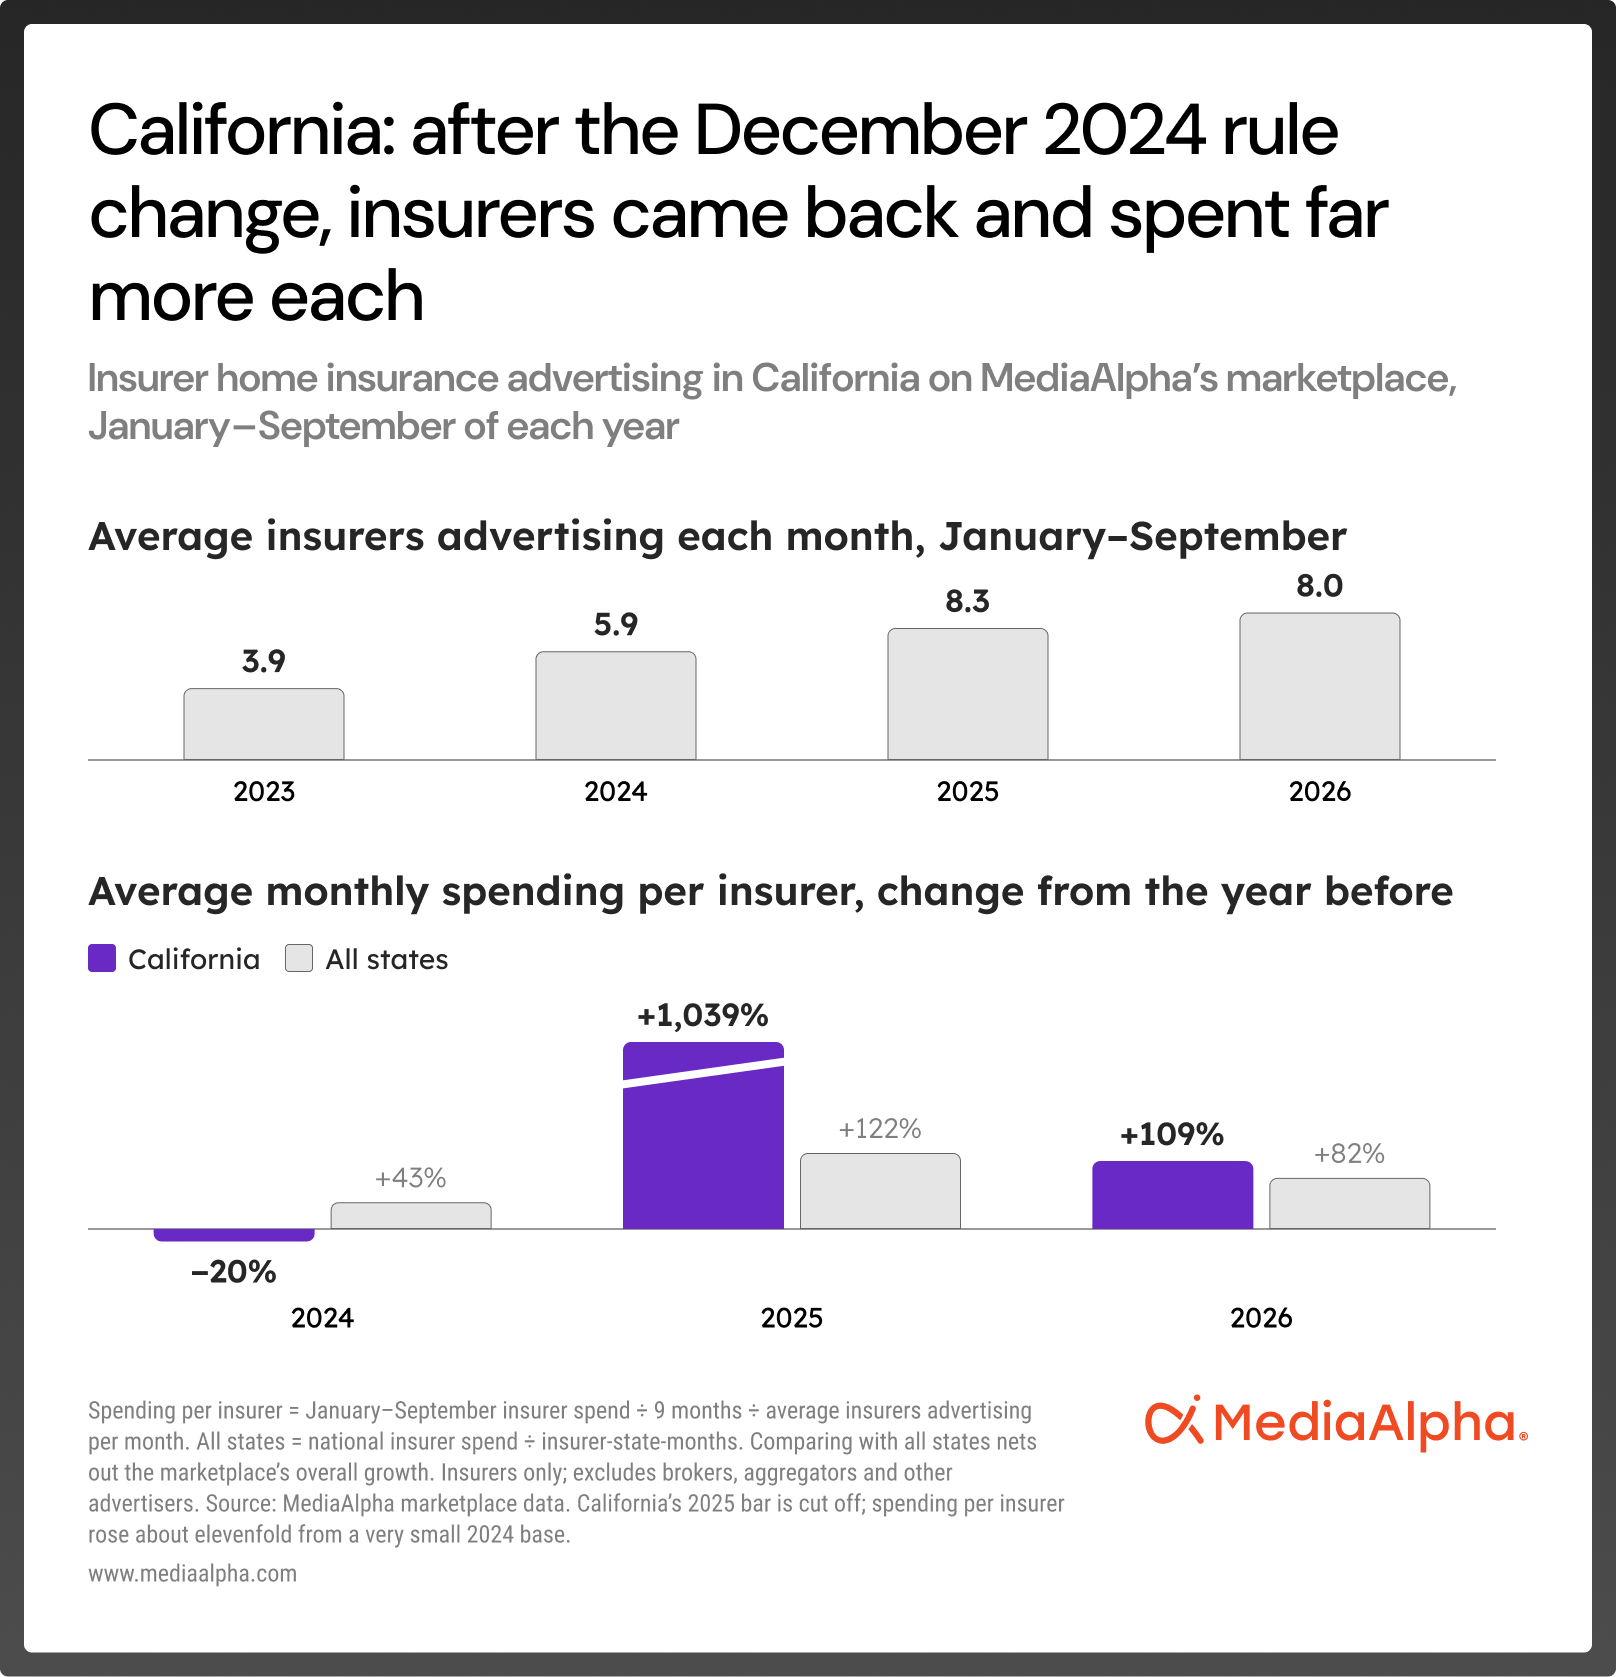
By July–September 2026, insurer home ad spending was nearly 50 times the same period in 2024, and California is now growing faster than the rest of the U.S.: In January–September 2026, average monthly spending per insurer in California increased 109% from the same months of 2025, compared with 82% across all states.
The biggest insurers are following. In September 2026, the state reported that State Farm and Allstate had filed plans to begin writing new homeowners policies again, for the first time since 2023 and 2022, respectively. (Note: As of October 2026, neither is open for new business in California.)
Florida is (still) one of the biggest home insurance ad markets, but advertising spend has fallen
 Florida’s home insurance market has turned around since the state passed SB 2-A and HB 837, both of which curbed costly lawsuits against insurers. The reforms, along with the start of a broader market recovery, brought insurers back to the state. On MediaAlpha’s marketplace, the average number of insurers advertising in Florida each month more than doubled, from 2.9 in January–September 2023 to 6.6 in the same months of 2024, and each spent 54% more, compared with 43% across all states.
In late 2023, when insurers were spending little to reach homeowners elsewhere, Florida accounted for about half of all insurer home ad spend on MediaAlpha’s marketplace. By mid-2024, insurer home ad spending on MediaAlpha’s marketplace in Florida was nearly five times its average month in 2023. It dipped after Hurricanes Helene and Milton that fall but partly recovered by early 2025.
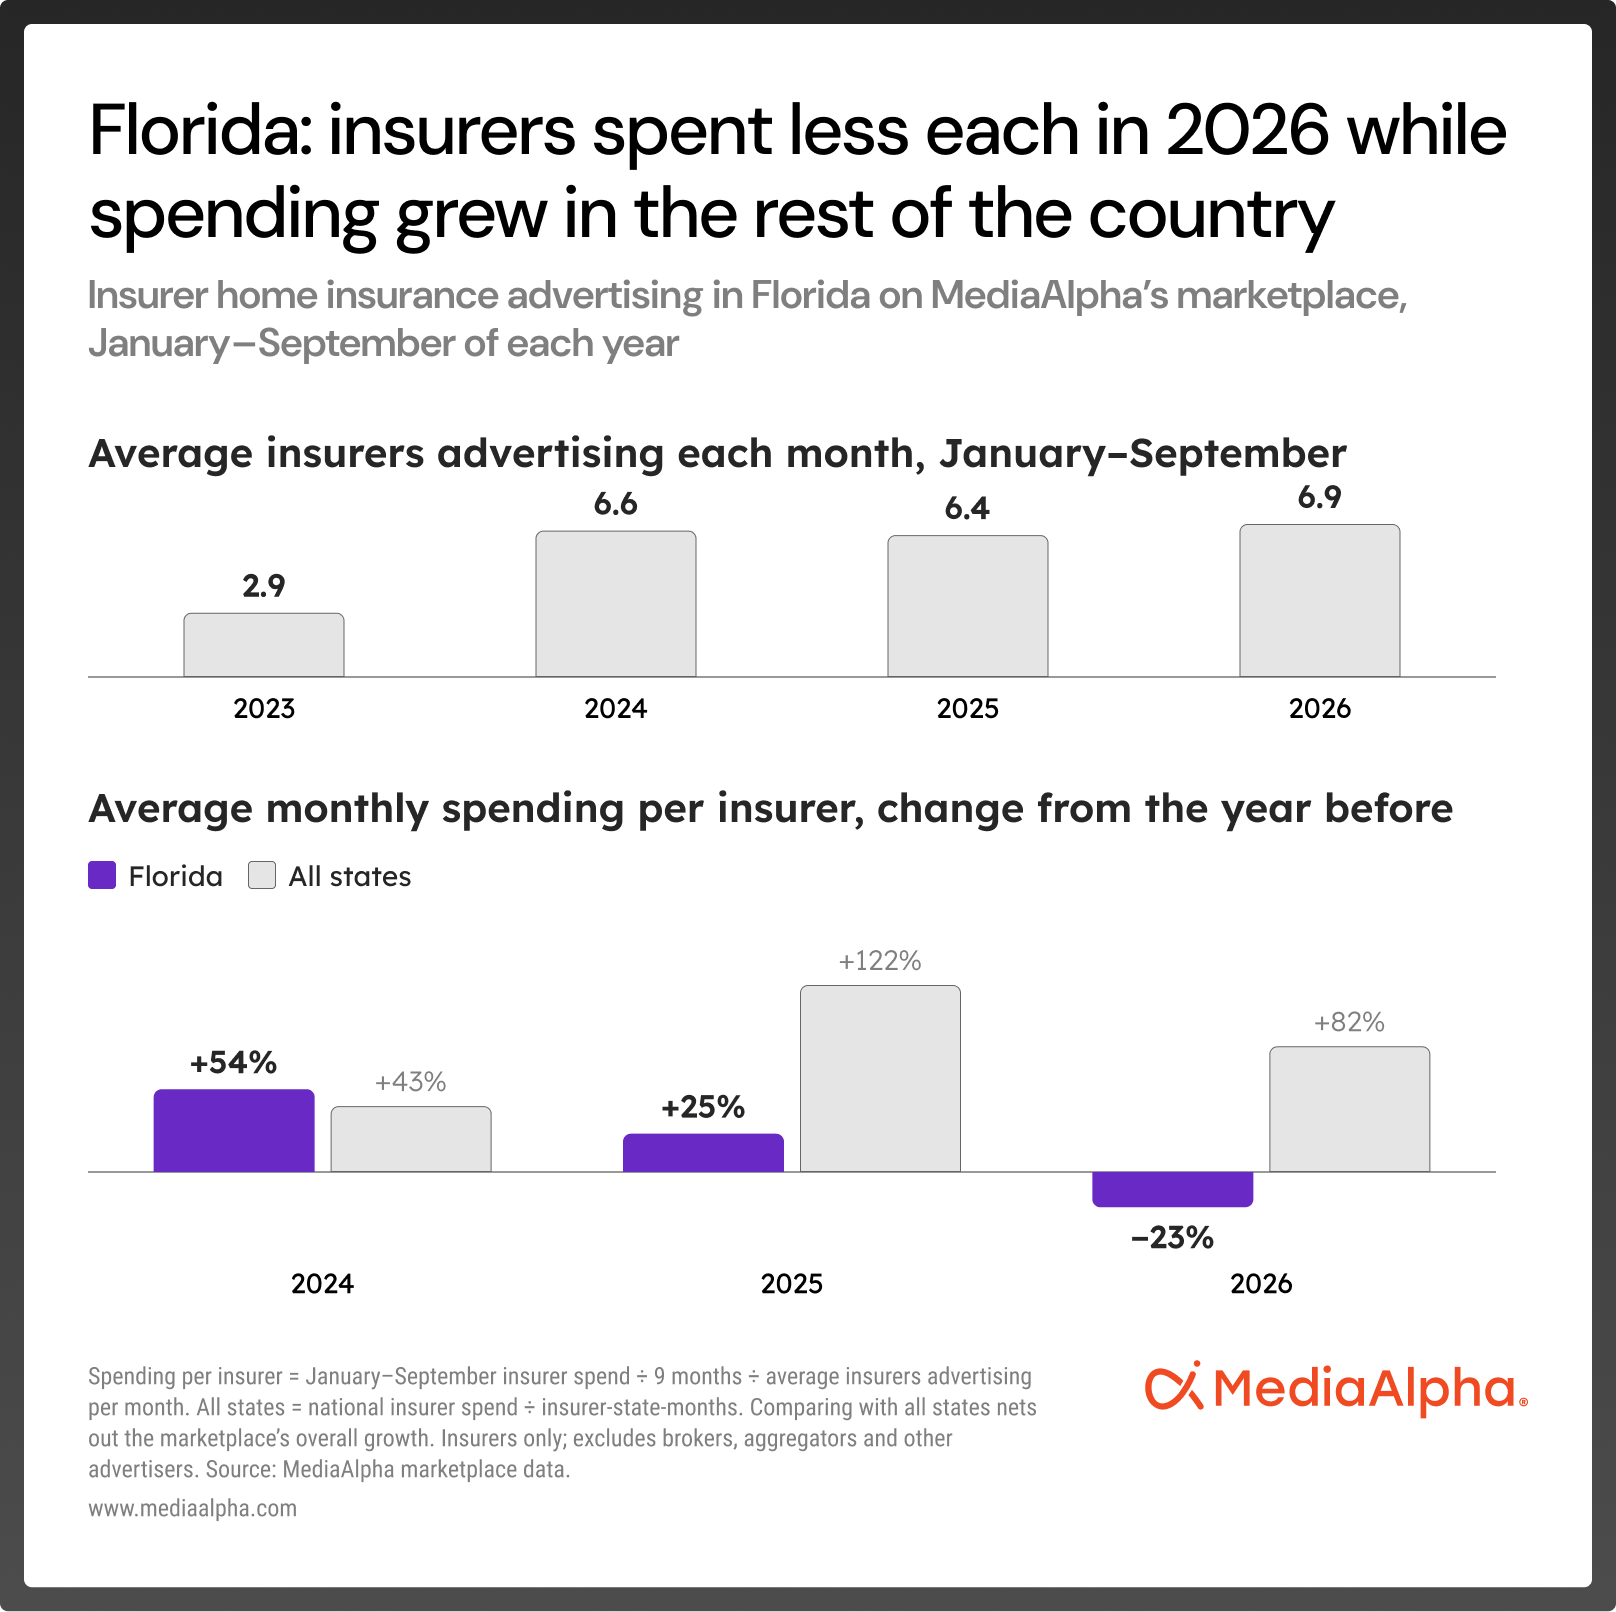
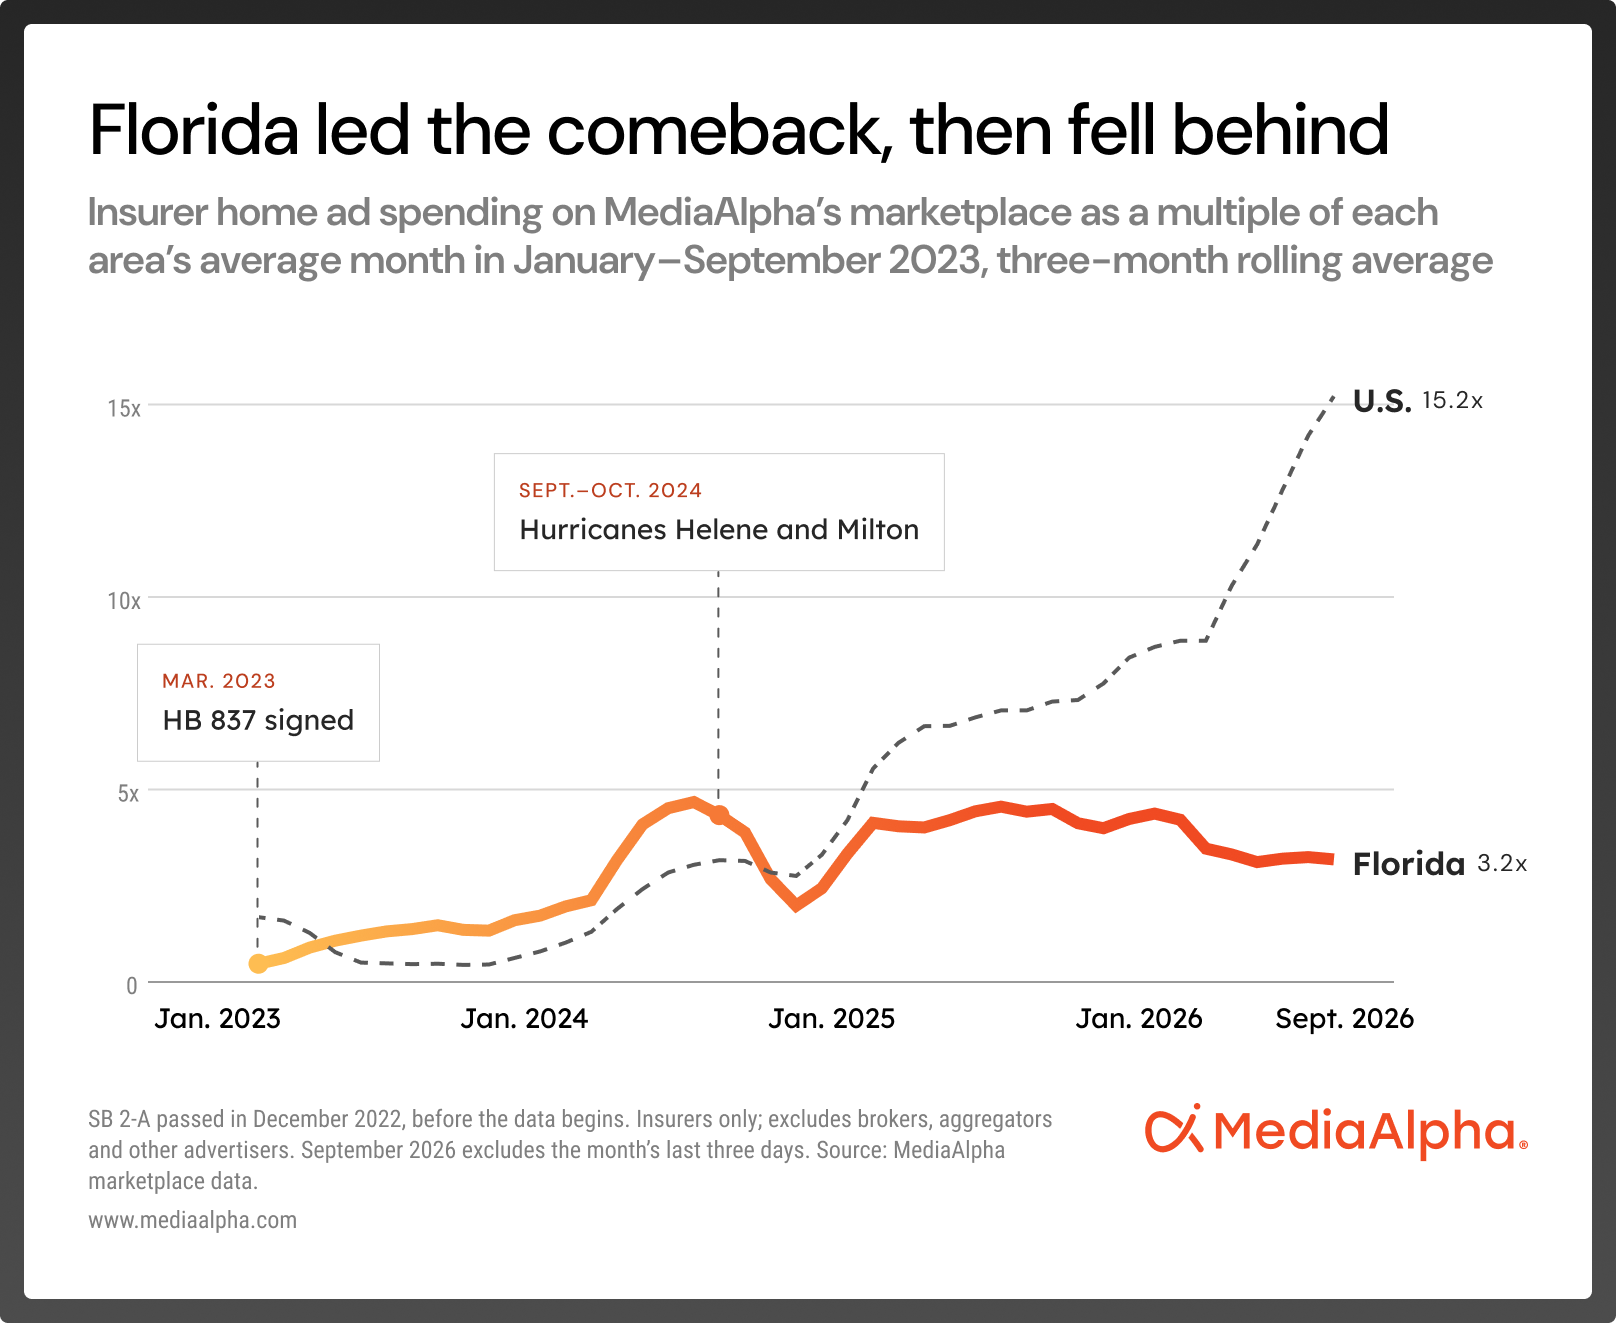
Florida is still one of the biggest markets for insurers competing for homeowners, drawing about 5% of total insurer home ad spending on MediaAlpha’s marketplace in January–September 2026, the fourth-most of any state. But as other states recovered, Florida fell behind. Average monthly home ad spending per insurer in Florida fell 23% in January–September 2026 from the same months of 2025, while across all states it increased 82%.
One possible explanation: Many insurers are growing by taking over policies from Citizens, the state’s insurer of last resort, rather than competing for new customers. Florida law requires Citizens customers to accept a private insurer’s offer if it’s priced within 20% of their Citizens premium, giving insurers a pipeline of customers without advertising. Citizens has shrunk from about 1.4 million policies in September 2023 to about 270,000 in September 2026.
Reforms brought insurers back to Florida. The next question is whether they’ll compete for homeowners once there are fewer Citizens policies left to take over.
Just peachy: How Georgia quietly became the No. 2 home insurance ad market on MediaAlpha’s marketplace
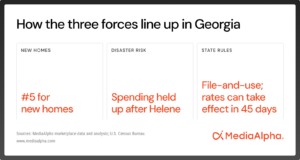
Georgia gets little attention in coverage of the home insurance market, but in January– September 2026, it was MediaAlpha’s second-largest home insurance ad market by insurer spending, behind only Texas.
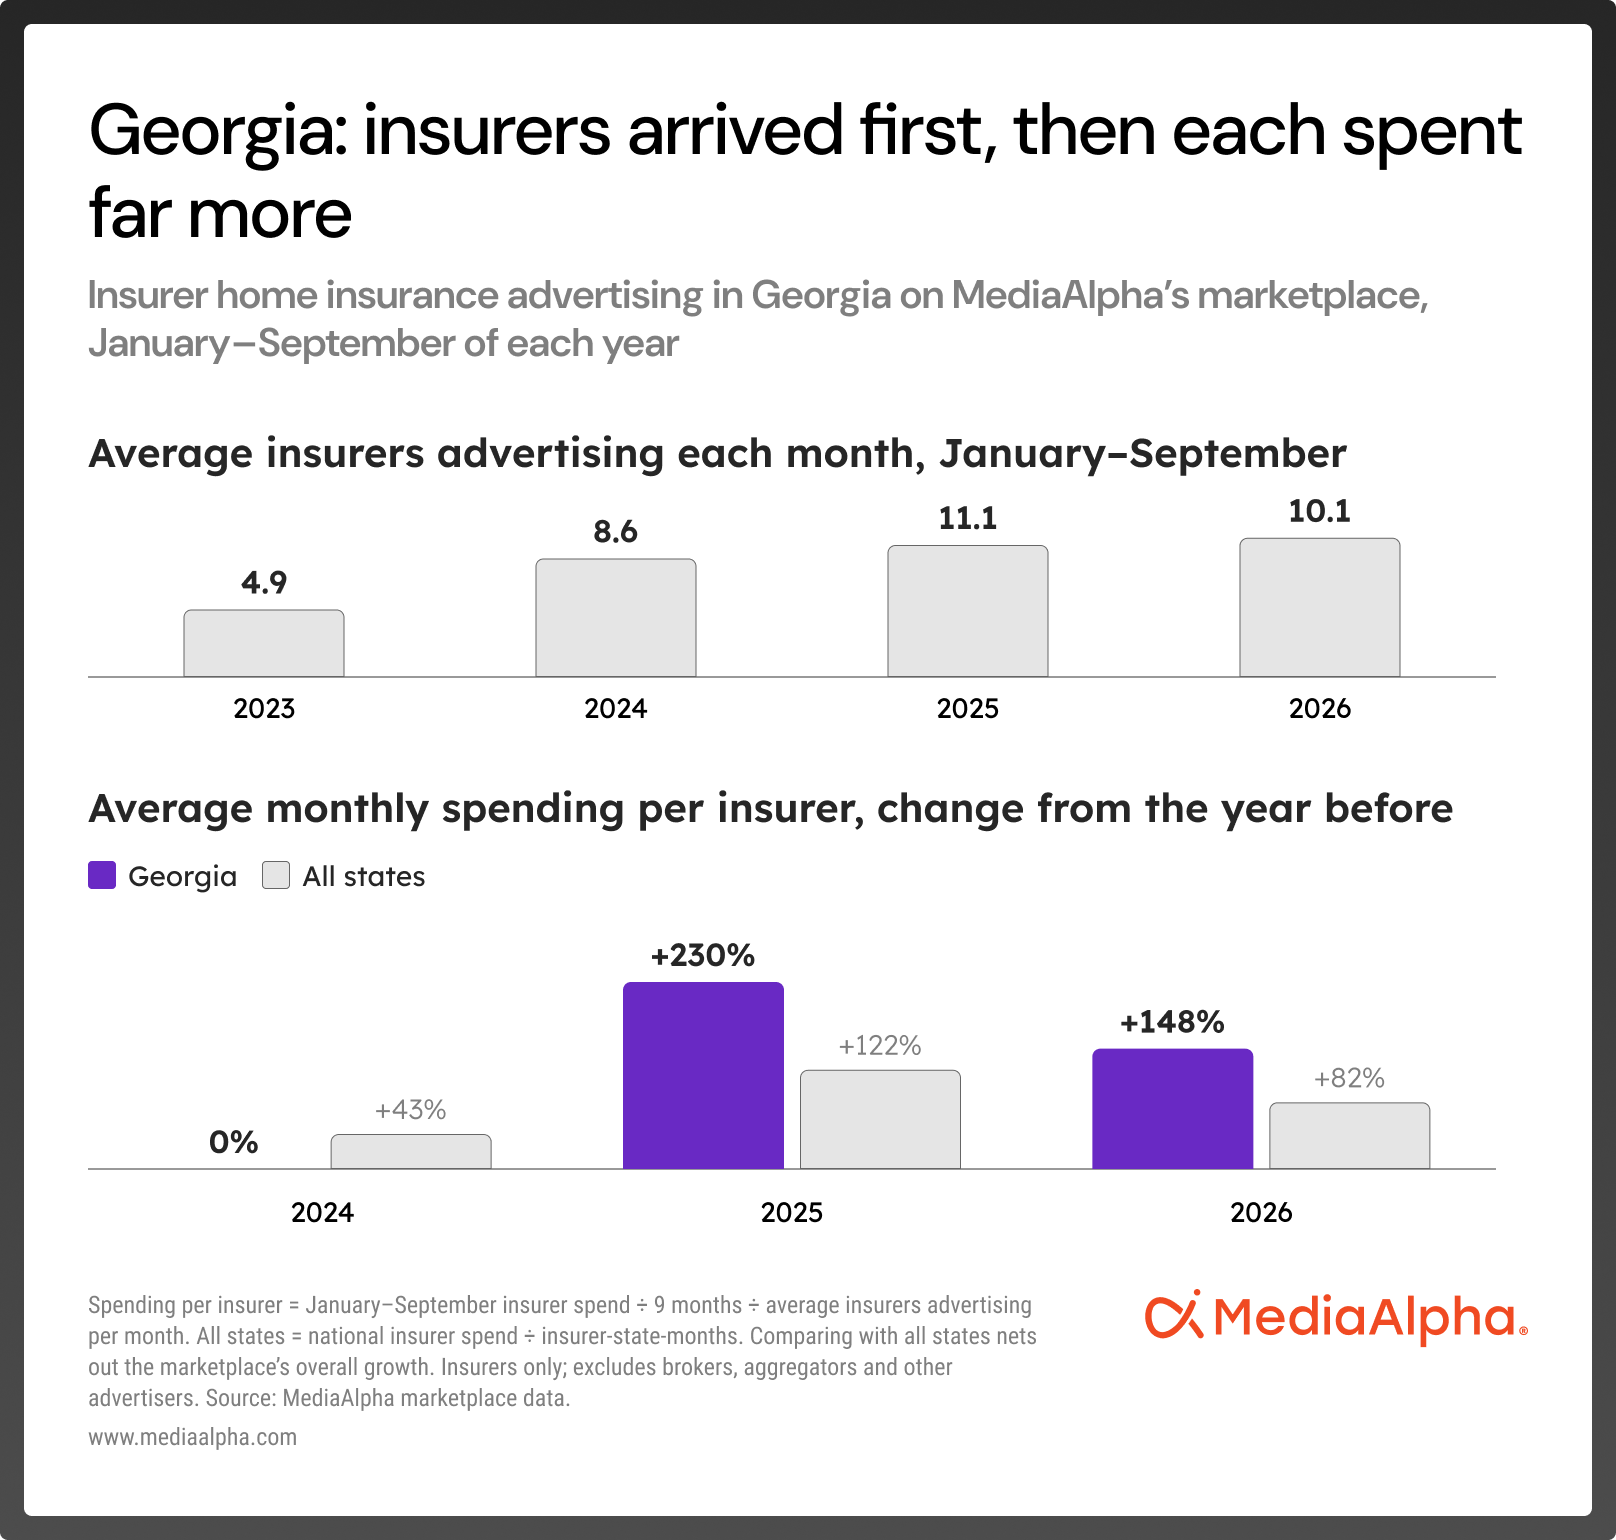
The growth came in two stages. First, more insurers arrived: The average number of insurers advertising each month on MediaAlpha’s marketplace rose from about 5 in 2023 to about 9 in 2024. Average monthly home ad spending per insurer held flat in Georgia in 2024, while across all states it rose 43%.
Then, advertising spend per insurer grew. In 2025, the number of insurers spending on advertising on MediaAlpha’s marketplace grew to about 11, and average monthly spending per insurer in Georgia more than tripled from the same months of 2024: It rose 230%, compared with a 122% rise across all states. In January–September 2026, spending per insurer rose another 148% from a year earlier, driven largely by one national insurer’s expansion, compared with 82% across all states.
Some of the explanation may be growth: Georgia ranks fifth for new single-family homes. Its rules also give insurers some flexibility, since they can use new rates 45 days after filing them. Georgia is a market to watch.
Illinois: New rules coming to Illinois, insurers are playing a bigger game now
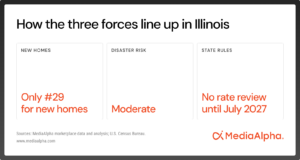 Until this year, Illinois was one of only two states that didn’t review insurance rates. Laws signed in August 2026, give the state authority to review rate changes, but not until July 1, 2027.
In the meantime, insurers are competing hard for Illinois homeowners. The state ranks just 29th for new single-family homes from 2021 to 2025 but fifth for insurer home ad spending on MediaAlpha’s marketplace in January–September 2026. Fewer insurers are spending more: An average of about 12 insurers advertised in Illinois each month in 2026, down from about 15 in 2025.
In January–September 2026, average monthly spending per insurer in Illinois roughly tripled from a year earlier (+203%), far outpacing the 82% increase across all states. That followed a 147% rise in 2025, compared with 122% across all states. That was the year a major insurer raised its Illinois home rates by an average of 27.2%, which may have sent many homeowners shopping.
That makes Illinois a rare test: What happens to insurer competition when a state that left pricing to the market starts reviewing rates?
Closing thoughts: What and where to watch next
The retreat chapter in home insurance is closing. Insurers are spending to win homeowners again, returning to storm-hit markets within months, and following regulatory change into states they had pulled back from.
But the comeback is uneven. Insurers have followed the size of a market more than the pace of its growth, so some of the fastest-building states draw little competition. And more insurers competing in a state doesn’t mean coverage is affordable, or available, for every home, especially in the places most exposed to disasters.
The forces that brought insurers back are still shifting. The year ahead will test whether that competition holds:
- Beyond the early leaders: whether growth spreads past Texas, Georgia, and California.
- California: whether its return continues as its largest insurers move to resume writing new policies.
- Illinois: how competition changes once the state begins reviewing rates in July 2027.
- Severe weather: whether a strong El Niño year brings dips, not exits.
But insurers have shown they’ll compete when the conditions are right. The year ahead will show which markets offer those conditions, and which get left behind.
Methodology
This report analyzes aggregated data from MediaAlpha’s insurance customer-acquisition marketplace, which connects consumers shopping for insurance online with insurers and other buyers.
Advertising spend is what advertisers paid MediaAlpha for clicks, calls and leads from January 2023 through September 2026, by state, insurance product and advertiser type. Unless noted, spend figures are for insurers only. Where noted, totals include all advertisers: insurers, brokers, aggregators and buyers not labeled by type. The report uses three measures of spending:
- Total insurer spending is the combined spending of all insurers advertising on MediaAlpha’s marketplace, including insurers that joined or left during the period. It’s used for market shares, state rankings and overall growth (for example, Texas’s 19% share of insurer spending.)
- Same-insurer spending compares only insurers that advertised in both periods, matched month by month, so insurers joining or leaving the marketplace don’t inflate the change. Multi-year growth chains these yearly comparisons (for example, the 84% increase in 2026 and the roughly 7.5-fold increase since 2023).
- Spending per insurer divides an area’s January–September insurer spending by nine months and by the average number of insurers advertising there each month. Comparing a state’s change with the change across all states, calculated the same way, nets out the marketplace’s overall growth. It’s used in the state profiles (for example, Texas’s 57% increase compared with 82% across all states).
Even a stable group of insurers can spend more as MediaAlpha’s marketplace grows, so all figures describe activity on the marketplace, not the insurance market as a whole.
Searches are anonymized, aggregate consumer shopping sessions across MediaAlpha’s publisher network. To separate changes in consumer demand from changes in MediaAlpha’s own network, search growth rates count only publishers active in every month being compared (“stable publishers”). This reduces, but doesn’t remove, the effect of changes in MediaAlpha’s network. Search totals include all publishers.
Unless noted, comparisons are January–September 2026 versus the same months of prior years. September 2026 figures exclude the month’s last three days. New home construction figures are single-family housing units permitted from 2021 to 2025, from the U.S. Census Bureau’s Building Permits Survey. Per-resident figures divide those totals by each state’s 2025 population, from the Census Bureau’s Vintage 2025 population estimates; state shares and rankings are MediaAlpha calculations.
All figures describe activity on MediaAlpha’s marketplace and may not reflect the insurance market as a whole; outside sources are cited where used.
For inquiries about our methodology, contact data@mediaalpha.com. For other inquiries, contact mediaalpha@thekeypr.com


Contact Us
Book a Custom Demo
See how MediaAlpha’s platform can help drive better results for your business.
"*" indicates required fields