Press Release
MediaAlpha Announces Third Quarter 2020 Financial Results
Revenue of $152 million, growing 37% year-over-year | Revenue from Property & Casualty grew 73% year-over-year | Transaction Value reaches a record $218 million, with 44% growth year-over-year
LOS ANGELES–(BUSINESS WIRE)–MediaAlpha, Inc. (NYSE: MAX), today announced its financial results for the third quarter ended September 30, 2020.
“We are pleased to announce a strong start to our journey as a public company, with record Transaction Value surpassing $200 million, driven by continued growth in our Property & Casualty insurance vertical,” said Steve Yi, Co-founder and CEO. “We continue to benefit from positive secular trends in the insurance industry, and our transparent, data science-based approach continues to drive outstanding results for our demand and supply partners. Customer acquisition investment from our Top 10 demand partners increased 95% year-over-year, which enabled us to expand our partnerships with existing suppliers as well as to attract new supply partners. With a robust ecosystem, we confidently expect to reach record revenue for the year, as reflected in our fourth quarter and full year revenue guidance.”
Third Quarter 2020 Financial Results
- Revenue of $151.5 million, an increase of 37% year-over-year;
- Transaction Value of $217.6 million, an increase of 44% year-over-year;
- Gross margin of 13.7%, as compared to 16.0% from the same period in 2019;
- Contribution Margin of 14.3%, as compared to 16.9% from the same period in 2019;
- Net income was $4.8 million, as compared to $7.8 million in the third quarter of 2019; and
- Adjusted EBITDA was $14.0 million, compared to Adjusted EBITDA of $11.7 million in the third quarter of 2019
A reconciliation of GAAP to Non-GAAP financial measures has been provided at the end of this press release. An explanation of these measures is also included below under the heading “Non-GAAP Financial Measures.”
Financial Outlook
For the fourth quarter of 2020, MediaAlpha currently expects the following:
- Transaction Value between $223 – $225 million, representing 32% year-over-year growth at the midpoint of the guidance range
- Revenue between $163 – $165 million, representing 30% year-over-year growth at the midpoint of the guidance range
- Contribution between $24.5 – $25.5 million, representing 16% year-over-year growth at the midpoint of the guidance range
- Adjusted EBITDA between $15.0 – $15.5 million, representing 9% year-over-year growth at the midpoint of the guidance range
For the full year 2020, MediaAlpha currently expects the following:
- Transaction Value between $782 – $784 million, representing 40% year-over-year growth at the midpoint of the guidance range
- Revenue between $558 – $560 million, representing 37% year-over-year growth at the midpoint of the guidance range
- Contribution between $86 – $87 million, representing 25% year-over-year growth at the midpoint of the guidance range
- Adjusted EBITDA between $54.5 – $55.5 million, representing 28% year-over-year growth at the midpoint of the guidance range
We expect total shares outstanding to be 58.5 million and 64.5 million on a common and fully diluted basis at the end of Q4 2020.
With respect to the Company’s projections of Contribution and adjusted EBITDA under “Financial Discussion – Q4 and FY 2020 Outlook”, MediaAlpha is not providing a reconciliation of Contribution or adjusted EBITDA to the respective GAAP measures because the Company is unable to predict with reasonable certainty the reconciling items that may affect gross profit and net income without unreasonable effort, including equity-based compensation, transaction expenses and income tax expense. These reconciling items are uncertain, depend on various factors and could significantly impact, either individually or in the aggregate, the GAAP measures for the applicable period.
For a detailed explanation of the Company’s non-GAAP measures, please refer to the appendix section of this press release.
As of and for the three and nine months ended September 30, 2020, the periods covered by this release, MediaAlpha, Inc. had engaged solely in activities incidental to its formation. QL Holdings LLC and its subsidiaries have been determined to represent the predecessor entity to MediaAlpha, Inc. prior to the IPO. As such, the interim unaudited condensed consolidated financial statements and related notes of QL Holdings LLC and its subsidiaries as of and for the three and nine months ended September 30, 2020 and 2019 have been included in this release and on the Form 10-Q.
Conference Call Information
MediaAlpha will host a Q&A conference call today to discuss the Company’s Q3 2020 results at 2:00 p.m. Pacific Time (5:00 p.m. Eastern Time). A live audio webcast of the call will be available on the MediaAlpha Investor Relations website at https://investors.mediaalpha.com. To register for the webcast, click here. Participants may also dial-in, toll-free, at (833) 350-1346 or internationally at (236) 389-2445 with Conference ID#2271129. An audio replay of the conference call will be available for two weeks following the call and available on the MediaAlpha Investor Relations website at https://investors.mediaalpha.com.
We have also posted to our investor relations website a letter to shareholders. We have used, and intend to continue to use, our investor relations website at https://investors.mediaalpha.com as a means of disclosing material nonpublic information and for complying with our disclosure obligations under Regulation FD.
Forward-Looking Statements
This press release contains forward-looking statements within the meaning of the Private Securities Litigation Reform Act of 1995. These forward-looking statements reflect our current views with respect to, among other things, future events and our financial performance. These statements are often, but not always, made through the use of words or phrases such as “may,” “should,” “could,” “predict,” “potential,” “believe,” “will likely result,” “expect,” “continue,” “will,” “anticipate,” “seek,” “estimate,” “intend,” “plan,” “projection,” “would,” and “outlook,” or the negative version of those words or other comparable words or phrases of a future or forward-looking nature. These forward-looking statements are not historical facts, and are based on current expectations, estimates and projections about our industry, management’s beliefs and certain assumptions made by management, many of which, by their nature, are inherently uncertain and beyond our control. Accordingly, we caution you that any such forward-looking statements are not guarantees of future performance and are subject to risks, assumptions and uncertainties that are difficult to predict. Although we believe that the expectations reflected in these forward-looking statements are reasonable as of the date made, actual results may prove to be materially different from the results expressed or implied by the forward-looking statements.
There are or will be important factors that could cause our actual results to differ materially from those indicated in these forward-looking statements, including those more fully described in MediaAlpha’s filings with the Securities and Exchange Commission (“SEC”), including the final prospectus filed with the SEC pursuant to Rule 424(b) promulgated under the Securities Act of 1933, as amended (the “Securities Act”), on October 29, 2020 and the Quarterly Report on Form 10-Q that will be filed following this earnings release. These factors should not be construed as exhaustive. MediaAlpha disclaims any obligation to update any forward-looking statements to reflect events or circumstances that occur after the date of this release.
Non-GAAP Financial Measures and Operating Metrics
This press release includes Adjusted EBITDA, Contribution, and Contribution Margin, which are non-GAAP financial measures. The Company also presents Transaction Value, which is an operating metric not presented in accordance with GAAP. See the appendix for definitions of Adjusted EBITDA, Contribution, Contribution Margin and Transaction Value, as well as reconciliations to the corresponding GAAP financial metrics, as applicable.
We present Transaction Value, Adjusted EBITDA, Contribution, and Contribution Margin because they are used extensively by our management and board of directors to manage our operating performance, including evaluating our operational performance against budget and assessing our overall operating efficiency and operating leverage. Accordingly, the Company believes that Transaction Value, Adjusted EBITDA, Contribution, and Contribution Margin provide useful information to investors and others in understanding and evaluating its operating results in the same manner as its management team and board of directors. Each of Transaction Value, Adjusted EBITDA, Contribution, and Contribution Margin has limitations as a financial measure and investors should not consider it in isolation or as a substitute for analysis of our results as reported under GAAP.
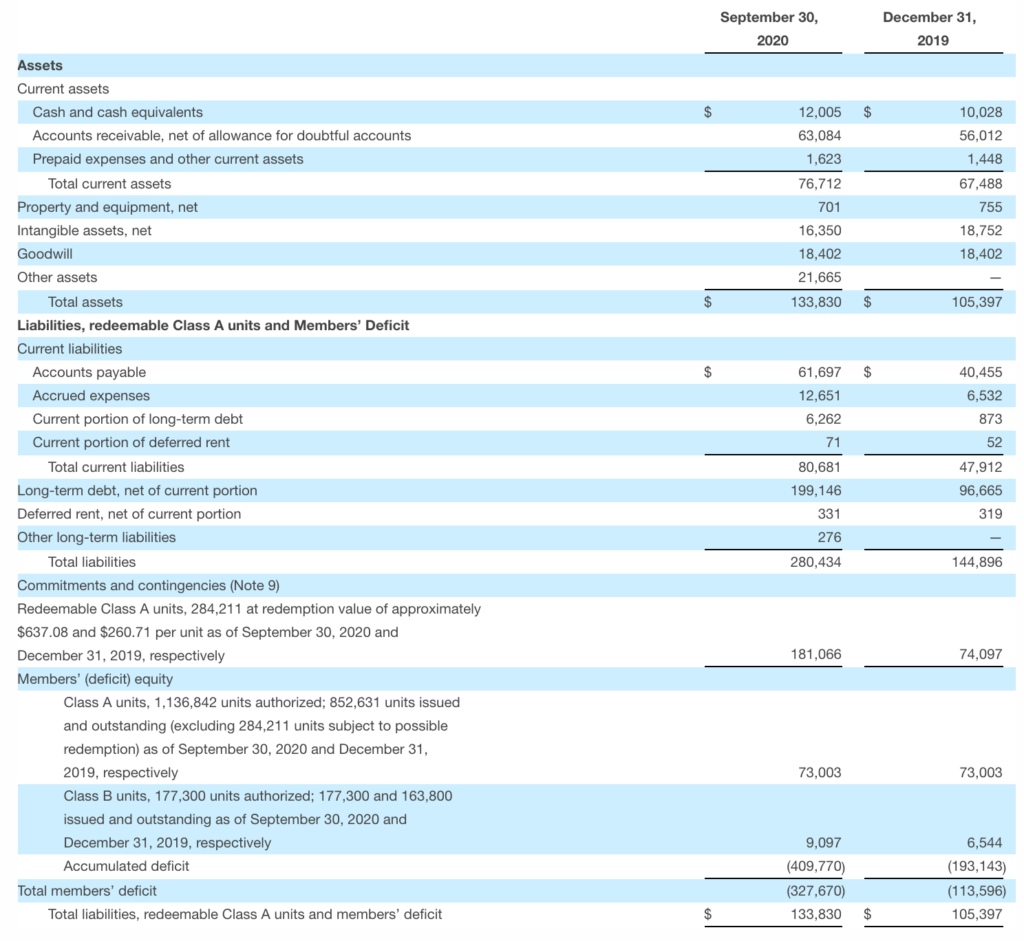
QL Holdings LLC and subsidiaries
Unaudited condensed consolidated balance sheets
(In thousands, except unit and per unit data)
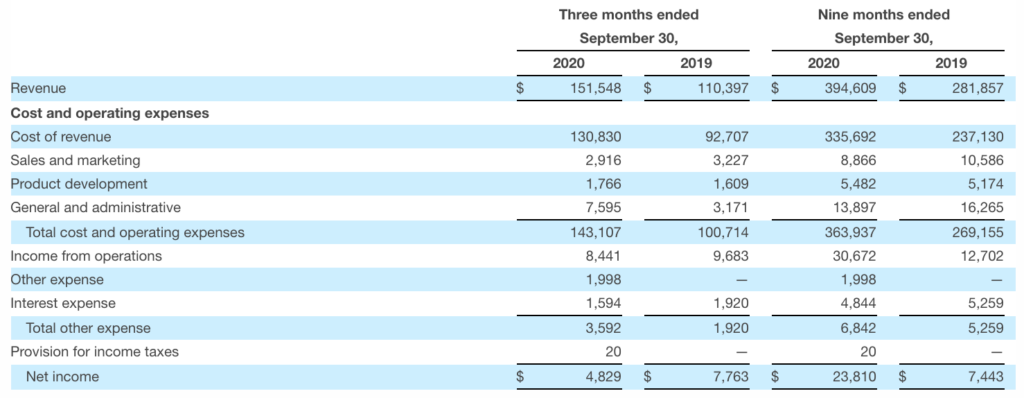
QL Holdings LLC and subsidiaries
Unaudited condensed consolidated statements of operations
(In thousands)
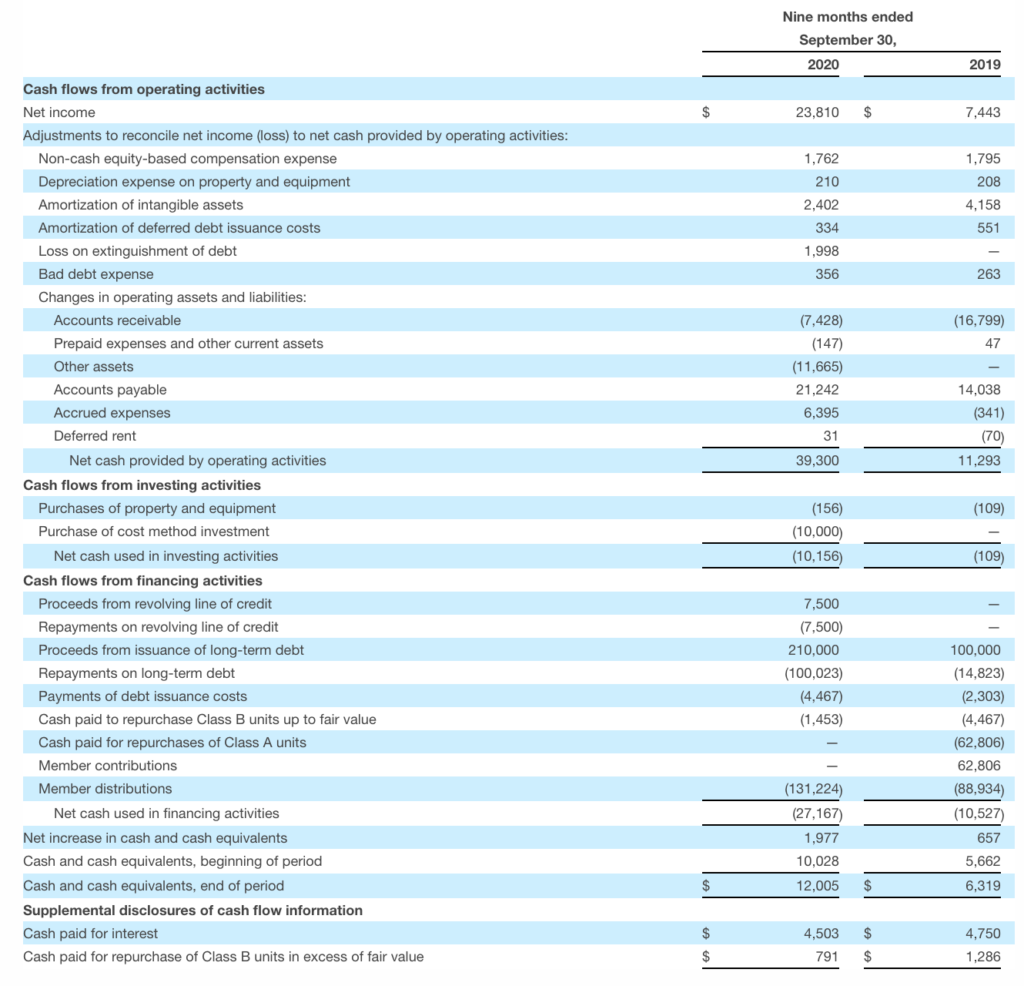
QL Holdings LLC and subsidiaries
Unaudited condensed consolidated statements of cash flows
(In thousands)
Transaction Value
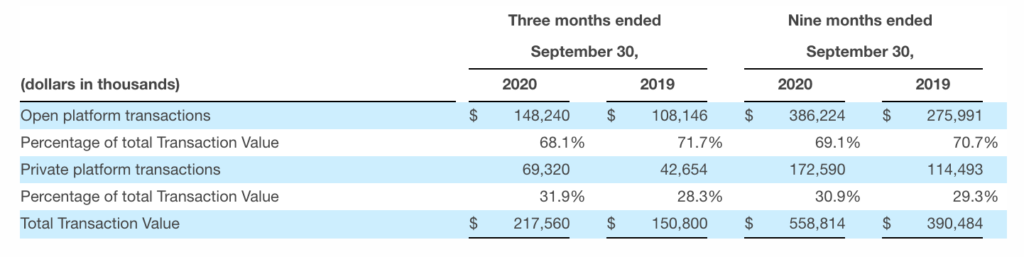
We define “Transaction Value” as the total gross dollars transacted by our partners on our platform. Transaction Value is a direct driver of revenue, with differing revenue recognition based on the economic relationship we have with our partners. Our partners use our platform to transact via open and private platform transactions. In our open platform model, revenue recognized represents the Transaction Value and revenue share payments to our supply partners represent costs of revenue. In our private platform model, revenue recognized represents a platform fee billed to the demand partner or supply partner based on an agreed-upon percentage of the Transaction Value for the Consumer Referrals transacted, and accordingly there are no associated costs of revenue. We utilize Transaction Value to assess revenue and to assess the overall level of transaction activity through our platform. We believe it is useful to investors to assess the overall level of activity on our platform and to better understand the sources of our revenue across our different transaction models and verticals.
The following table presents Transaction Value by platform model for the three months ended September 30, 2020 and 2019, and the nine months ended September 30, 2020 and 2019:
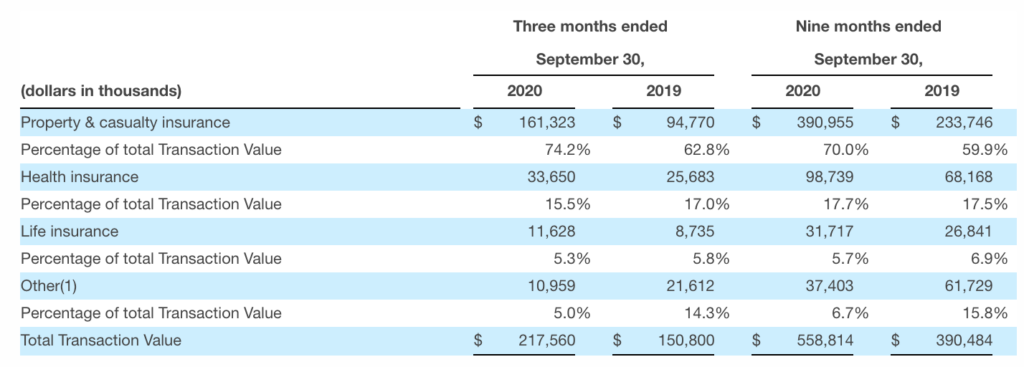
The following table presents Transaction Value by vertical for the three months ended September 30, 2020 and 2019, and the nine months ended September 30, 2020 and 2019:
Contribution and Contribution Margin
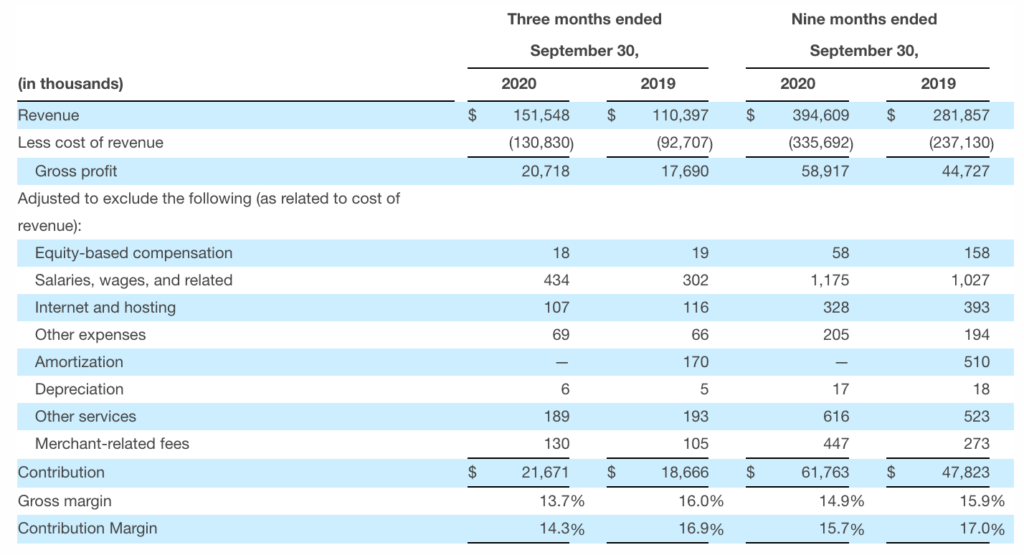
The following table reconciles Contribution and Contribution Margin with gross profit, the most directly comparable financial measure calculated and presented in accordance with GAAP, the three months ended September 30, 2020 and 2019, and the nine months ended September 30, 2020 and 2019:
Adjusted EBITDA
The following table reconciles Adjusted EBITDA with net income, the most directly comparable financial measure calculated and presented in accordance with GAAP, for the three months ended September 30, 2020 and 2019, and the nine months ended September 30, 2020 and 2019.
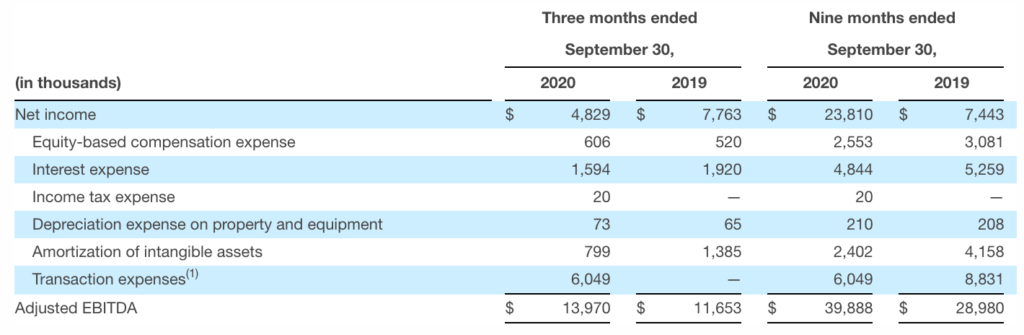
(1) For the nine months ended September 30, 2019, transaction expenses included $7.2 million in legal, investment banking and other consulting fees and $1.6 million in transaction bonuses related to a transaction with Insignia in February 2019. For the months ended September 30, 2020, transaction expenses included $4.0 million in legal, and other consulting fees and $2.0 million in loss on debt related to the termination of the 2019 Credit Facilities.
Key business and operating metrics
“Transaction Value” represents the total gross dollars transacted by our partners on our platform. Transaction Value is a direct driver of revenue, with differing revenue recognition based on the economic relationship we have with our partners. We utilize Transaction Value to assess revenue and to assess the overall level of transaction activity through our platform.
“Contribution” represents revenue less revenue share payments and online advertising costs, or, as reported in our consolidated statement of operations, revenue less cost of revenue, as adjusted to exclude the following items from cost of revenue: equity-based compensation; salaries, wages, and related; internet and hosting; amortization; depreciation; other services; and merchant-related fees. “Contribution Margin” represents Contribution expressed as a percentage of revenue for the same period. We use Contribution and Contribution Margin to measure the return on our relationships with our supply partners (excluding certain fixed costs), the financial return on our online advertising, and our operating leverage. We do not use Contribution and Contribution Margin as measures of overall profitability. We present Contribution and Contribution Margin because they are used extensively by our management and board of directors to manage our operating performance, including evaluating our operational performance against budget and assessing our overall operating efficiency and operating leverage.
“Adjusted EBITDA” represents net income excluding interest expense, income tax benefit (expense), depreciation expense on property and equipment, and amortization of intangible assets, as well as equity-based compensation expense and transaction expenses. Adjusted EBITDA is a key measure used by our management to understand and evaluate our operating performance, to establish budgets and to develop operational goals for managing our business. In addition, presenting Adjusted EBITDA provides investors with a metric to evaluate the capital efficiency of our business.
Contacts
Investors
Denise Garcia
Hayflower Partners
Denise@HayflowerPartners.com
Press
SHIFT
MediaAlpha@SHIFTComm.com